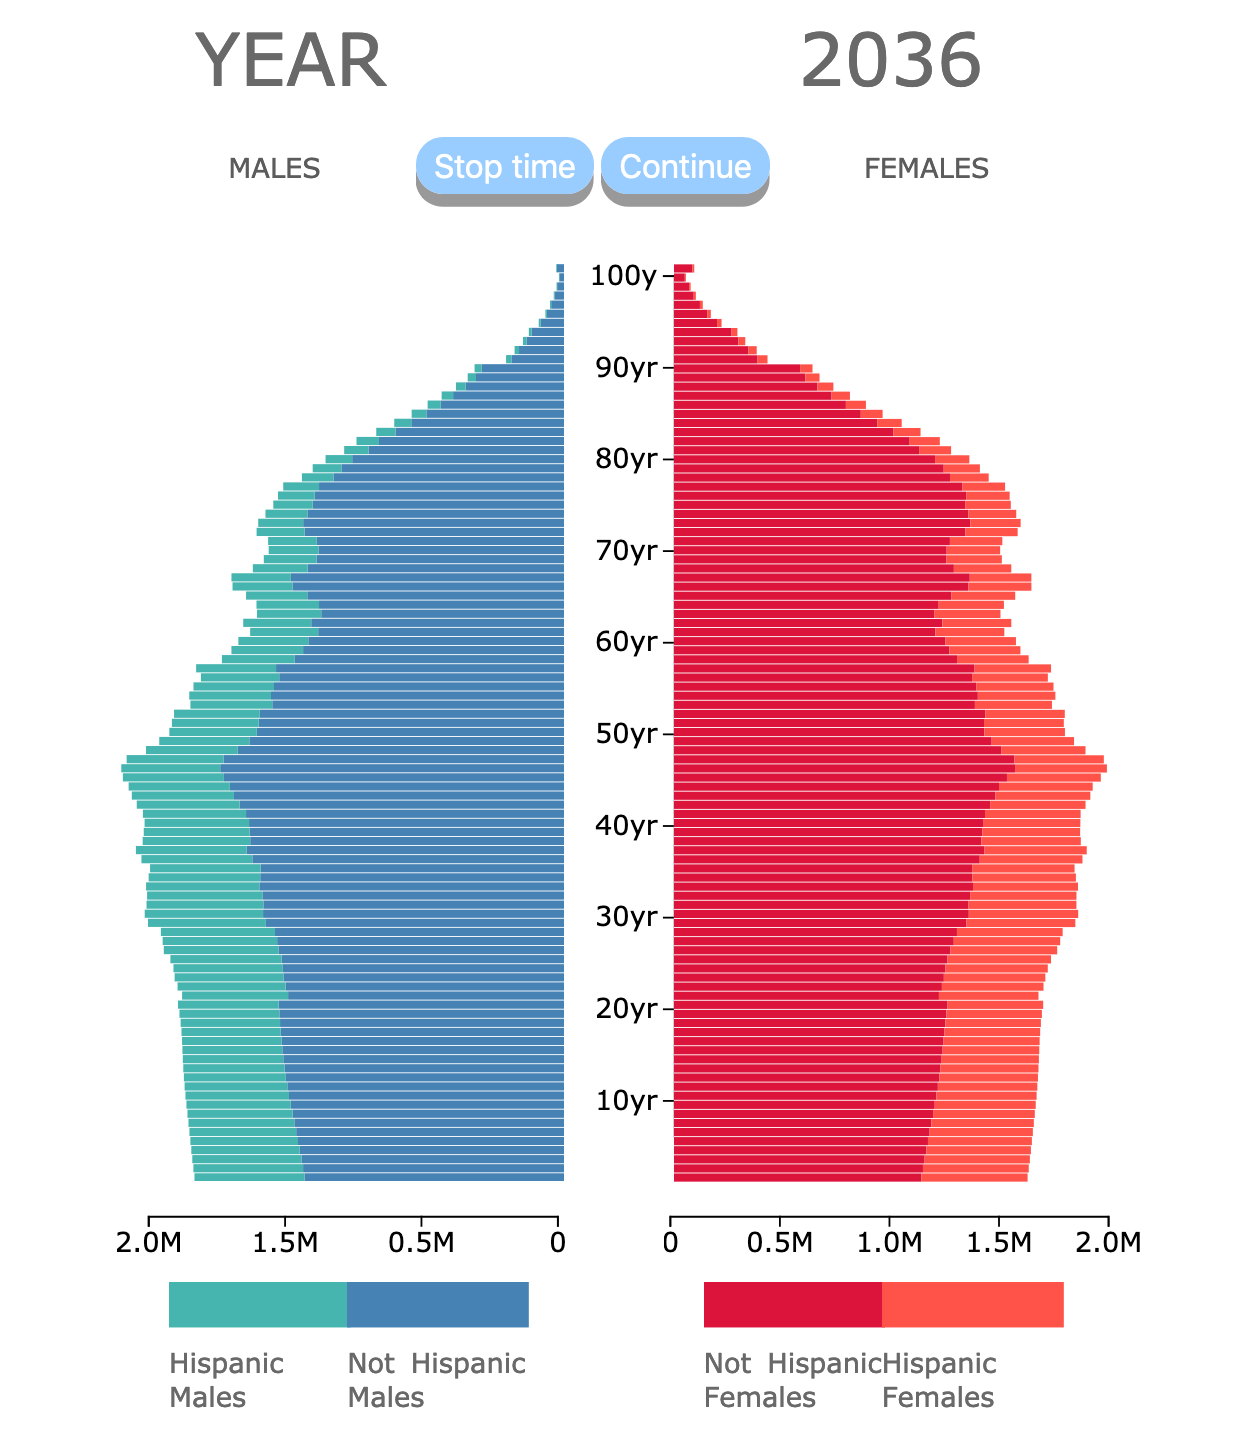
Population Pyramid of the United States by Ethnicity
This animated population pyramid displays the projected population of the United States. It includes information about Sex, Ethnicity, and Age, from 2016 to 2058. Every bar represents 1 year. The population values are given in millions.
YEAR
2016
Census and Ethnicity
The U.S. census tabulates data on race and ethnicity in two separate questions.
Race is classified as:
- White, non-Hispanic
- Black or African American, non-Hispanic
- American Indian or Alaska Native, non-Hispanic
- Asian, non-Hispanic
- Native Hawaiian or Other Pacific Islander, non-Hispanic
- Other race alone, non-Hispanic
- Hispanic
To learn more about population pyramids and population and race go to Population Pyramid by Race.
For ethnicity, the U.S. Census standards classify individuals in one of two categories: “Hispanic or Latino” or “Not Hispanic or Latino.”
The standards also emphasize that people of Hispanic origin may be of any race. But these diversity calculations require the use of mutually exclusive racial and ethnic categories.
For Diversity calculations the groups look like this:
- White
- Black or African American
- American Indian or Alaska Native
- Asian
- Native Hawaiian or Other Pacific Islander
- Other race
Source: Census.gov.
Hispanic Population
The Hispanic Population was 62.1 million in 2020. The Hispanic population grew 23% from 2010 to 2020. In the same period the white population grew 4.3%; U.S. Census.
Hispanics are the second largest group after white Americans, and ahead of Black Americans.
Hispanics are the largest groups in 2 states, California and New Mexico.
While most of the Hispanic Population lives in California, Texas, and Florida.
Most Hispanics have a Mexican origin. They account for 61.5% of the Hispanic population. The second largest group comes from Puerto Rico. They are followed by Cubans and Salvadorans. Source: Pew Research.
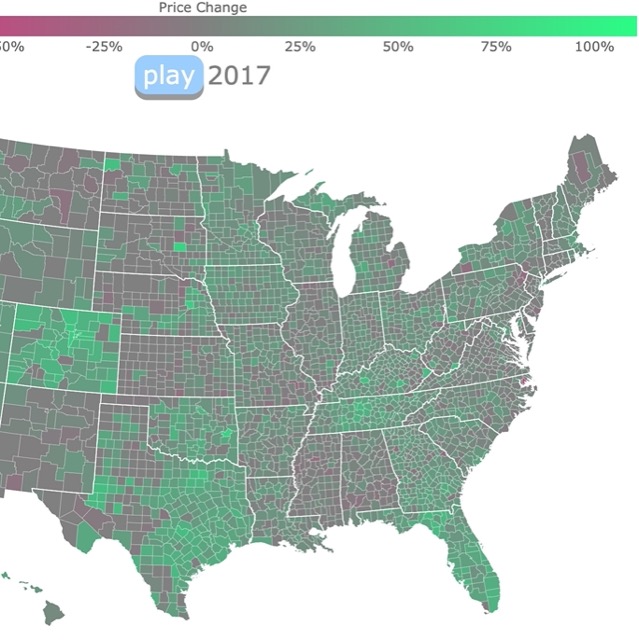
Population Growth and Migration affect Home Value too. Check this map with Housing Prices.
Resources for Ethnicity Population Pyramid
The Data was gathered from Population Projections Datset by the US Census Bureau.
According to 2017 National Population Projections, "Hispanic origin is considered an ethnicity, not a race. Hispanics may be of any race".
Therefore, I made a separate pyramid for Ethnicity. Further information at NP2017_D1: Projected Population by Single Year of Age, Sex, Race, and Hispanic Origin for the United States: 2016 to 2060. For a detailed Pyramid by Race go to this link.
The code for the stack bar was obtained from ywwhack's block.
Created using d3.js.
Inspiration
This population pyramid was inspired by the resent news about the USA being a Minority Majority country.
Also by news stating the US had more minority children than white children.
With all this talk about race and ethnicity, I wanted to see and display how these new trends look like.
I also wanted to show how much they will change the composition of the USA population. Therefore, I looked into the US population projection for the next 50 years and made it into an animated pyramid.
I thought the best way to do this ethnicity pyramid, was to make a stacked bar. This way I could add an extra variable to the population pyramid. Not just sex and age, but ETHNICITY.
Made by Luz K. Molina.
FOLLOW ME