Real Estate Price Change in the US
This is an animated map that shows the development of home values throughout the US. Play the button to see the changes from 2000 to 2023. Hover over the counties to get detailed information from each county. For more information scroll down.
| Price Change | ||||||||||||
| -100% | -75% | -50% | -25% | 0% | 25% | 50% | 75% | 100% | 125% | 150% | 175% | 200% |


Home Value Map
This animated map of Real Estate property prices in the US, shows how home values have increased and changed since 2000.
Home prices were downloaded from Zillow Research. The values are calculated as an index. Fortunately, Zillow had data since 2000 to this year.
To show how the values progressed, the median of each year and each county were determined. Then the percentage of change was established.
Fuchsia shows decreasing values and green shows increasing values compared to the median.
During the first 10 years many counties have a -1% change. This is because there is no available Zillow data for them for that year, but there is, in later years. Nevertheless, until today out of 3,007 counties, 64 parishes, 19 organized boroughs, the data only includes 2844 counties, parishes and boroughs.
Below is a summary of the highest and lowest home values in the USA.
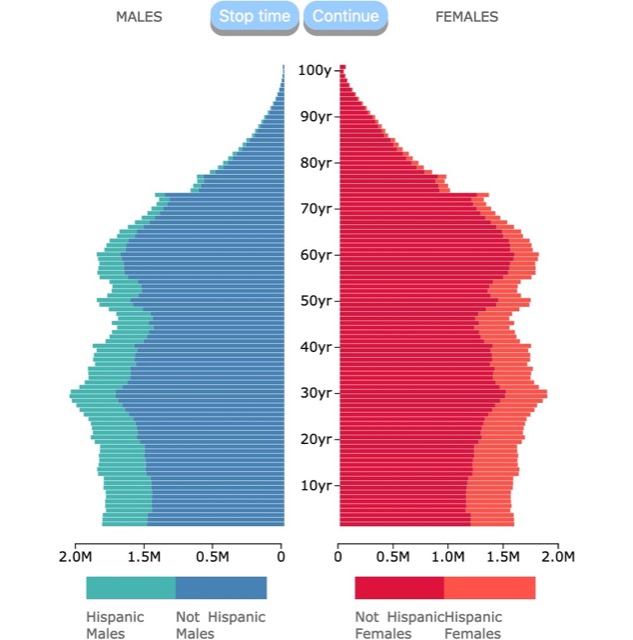
U.S. Population Pyramid by Ethnicity includes Hispanic and Non-Hispanic Population in the U.S.
20 Most Expensive Real Estate Counties in the US
- Nantucket County, MA: $2,512,654
- Pitkin County, CO: $1,988,724
- Teton County, WY: $1,639,540
- San Mateo County, CA: $1,461,983
- Santa Clara County, CA: $1,412,619
- San Miguel County, CO: $1,404,924
- Marin County, CA: $1,363,168
- Dukes County, MA: $1,360,436
- San Francisco County, CA: $1,288,007
- New York County, NY: $1,163,296
- Summit County, UT: $1,154,302
- Eagle County, CO: $1,089,576
- Santa Cruz County, CA: $1,044,931
- Alameda County, CA: $971,399
- Orange County, CA: $967,167
- Maui County, HI: $933,765
- Summit County, CO: $929,431
- Falls Church County, VA: $929,431
- Monroe County, FL: $928,078
- Routt County, CO: $919,779
These values are for 2023. East and West Coast are at the lead. This list definitely correlates with the Most Educated Counties of the U.S..
They are closely followed by ski resort cities in the Northwestern Mountains.
Most of these counties and metros have common traits sought by home buyers. Beautiful surroundings, highly educated communities, tech hubs, or commercial and business magnets.
Since 2020 tourism locations are the newest trait of these areas.
Number 1 is Nantucket County, Massachusetts. This island and a tourist destination draws thousands of people every summer. Having beautiful natural surroundings and being a historic landmark keeps people coming, and prices rising.
Pitkin County, Colorado Pitkin County enjoys the fourth highest per-capita county income in the United States, and is home of the city of Aspen. Surrounded by beautiful mountains and wilderness it is a Mecca for outdoor lovers, making its homes beautiful but expensive.
Teton County, Wyoming contains the Jackson Hole ski area, all of Grand Teton National Park, and 40.4% of Yellowstone National Park's total area. It is also among the most educated counties in the US. Its incredible surroundings make it a hub for real estate investors and tourists alike.
San Mateo County, Santa Clara County, Marin County, Santa Cruz County, Alameda County, Napa County, and Contra Costa County, California are all close to San Francisco California. Therefore, close to Silicon Valley and home to the world's largest high-tech corporations, plus Berkley University, a research hub. Finding a home in this area requires a large income and a stable job.
Dukes County, Massachusetts is home of renowned Martha's Vineyard! An island known as a popular summer getaway. The main attraction for home buyers is the pleasant summer weather and the beautiful beaches.
San Francisco County, California is not just a tech hub. It is one of the most densely populated areas and has the highest earning income in the world. The result is skyrocketing rents and property values.
New York County, New York is the most populous and most denseley populated county in the US. This plus the fact that it is a global hub of business and commerce makes it a magnet for home buyers.
Summit County, Utah was a definite surprise. So far, the counties mentioned above are well known for business, technology, commerce, or tourism. Summit County is neither. It is close to Salt Lake City, and has acquired a reputation as an upscale getaway, bringing new development to the area. Wikipedia.
Maui County, Hawaii. It consists of the islands of Maui, Lānaʻi, Molokaʻi, Kahoʻolawe, and Molokini. These beautiful islands are in the middle of the Pacific. For those same reasons, goods and services are higher than in other places in the U.S.
Falls Church and Arlington County, Virginia are close to D.C. and are one of the most educated areas in the country. Therefore, attracting competitive buyers that bring up home prices.
Monroe County, Florida has Key West. This is the southernmost city of the contiguous U.S. The area is sought after for its warm climate year-round.
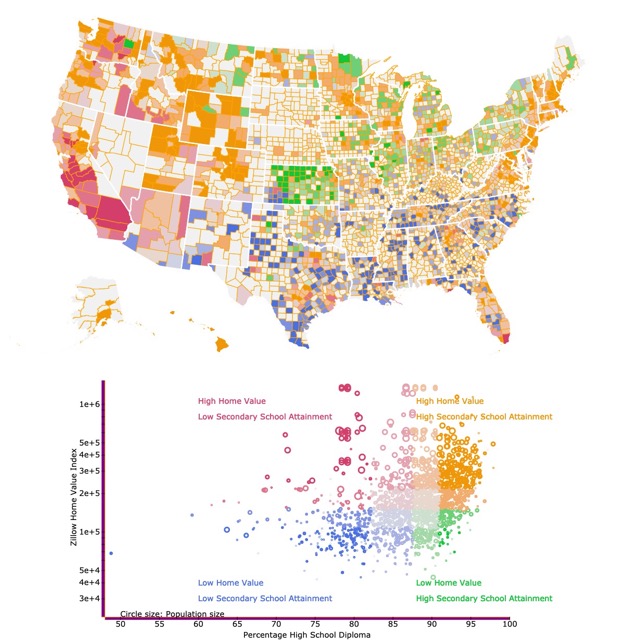
It is not just about home property price. This map shows you the best education with the least Real Estate price tag!
10 Counties with the Greatest Increase in Real Estate Value
The following counties had the greatest increase in the last years.
- Creene County, VA: 627%
- Petersburgh City, VA: 371%
- San Miguel County, CO: 339%
- Lawrence County, IL: 271%
- Hodgeman County, KS: 242%
- Anderson County, KS: 240%
- Calloway County, KY: 238%
- Gates County, NC: 232%
- Vernon County, MO: 230%
- Greyson County, KY: 228%

Real Estate Industry
The real estate industry is a business generating billions of dollars in revenue annually, and it offers many opportunities for entrepreneurs to turn a profit.
Last year there were approximately 210,000 companies operating in the residential brokerage and management field. They generated $200 billion in revenue.
There were 35,000 companies operating in the commercial brokerage and management field, generating $35 billion in revenue.
As displayed in this map Real Estate is a cyclical industry<, reacting to macroeconomic trends such as interest rates, population growth, and economic strength.
Real Estate soared in the post-World War II economic boom of the 1950s, sank in the inflation-riddled 1970s, rose again in the early 1980s until the depression at the end of that decade, and was prosperous again by the end of the century.
As it will be discussed below, low interest rates in the mid-2000s allowed residential Real Estate to boom even when the economy was slow - until the mortgage crisis hit, and prices collapsed. Source: Franchise Help
Population growth influences Real Estate Values. To see how it will change in the U.S.in the next decades check this article!
Housing Bubble 2008
This animation makes it possible to see the 2008 housing bubble. You can clearly see the rapid change in colors.
To make this even more clear and less distracting, there is a 0% change color to the counties that had no data. So counties with undefined% or 0% do not distract the viewer of the changes and trends. To know exactly which counties have missing values, you may hover over them. The data updates with the animation.
In the words of the Balance "The ultimate cause of the subprime mortgage crisis boils down to human greed and failed wisdom. The prime players were banks, hedge funds, investment houses, ratings agencies, homeowners, investors, and insurance companies."
"Banks lent, even to those who couldn’t afford loans. People borrowed to buy houses even if they couldn’t really afford them.
Investors created a demand for low premium MBS, which in turn increased demand for subprime mortgages. These were bundled in derivatives and sold as insured investments among financial traders and institutions."
"So when the housing market became saturated and interest rates started to rise, people defaulted on their loans which were bundled in derivatives. This was how the housing market crisis brought down the financial sector and caused the 2008 Great Recession."
Pandemic Real Estate
During the Pandemic Real Estate Prices increased dramatically in rural counties. Buyers sought homes in rural areas, searching for space to keep social distance.
Remote work also allowed people to seek larger homes with a home office.
This resulted in internal migrations that changed the Real Estate Market
Buyers with higher purchasing power from cities drove the prices in suburban areas.
Real Estate After the Pandemic
Disruptions caused by the supply chain pushed construction prices up. This in turn drove home prices to increase.
This has resulted in a volatile market. Some speculate that we are in a house market bubble. Time will tell......
COVID-19 has affected every industry including Real Estate. Check how it has evolved in the US.
Inspiration for a Property Value Map
I have always been interested in Real Estate prices and investment. I am not buying and selling property at the moment, but I definitely like to look at data related to it.
With this map I basically wanted to know: How Real Estate prices have changed? What are the housing market trends? Which are the most expensive areas to buy? Which areas are not prone to housing bubbles? Do Real Estate change the same in the East and in the West Coast? What are the Real Estate Prices near me?
FOLLOW ME
Resources for Real Estate Map
The counties shapefile, to create this Choropleth map, was downloaded from the US Census Bureau.
The code to make an animated choropleth map, was altered from rfdonohue's block.
For this visualization I used the Zillow Home Value Index (ZHVI): "a smoothed, seasonally adjusted measure of the typical home value and market changes across a given region and housing type". They were downloaded from Zillow Research.
Created using d3.js.