Map of Median Household Income by U.S. County
This is an interactive map of Median Income by U.S. county. Yellow shades represent lower income. Dark blue represents higher income. Hover over the map to see the county, state, GDP, income, population, and population density. Zoom in for more details. Scroll down for more information.
U.S. Median Household Income
The median household income is the income amount that divides a population into two equally-sized groups, half has an income above that amount, and half has an income below that amount.
The United States median household income was $69,717 in 2021.
The states with the highest median household income were Washington D.C., Maryland, Massachusetts, New Jersey, New Jersey, and New Hampshire.
The lowest median income states are Mississippi, West Virginia, Louisiana, Arkansas, and Alabama.
The data displayed on the map is from 2021.
To learn more about this topic, Amazon has Blind Spot: The Global Rise of Unhappiness and How Leaders Missed It. This book makes the urgent case that leaders should measure and quantify wellbeing and happiness — how citizens’ lives are going — and shows them how.
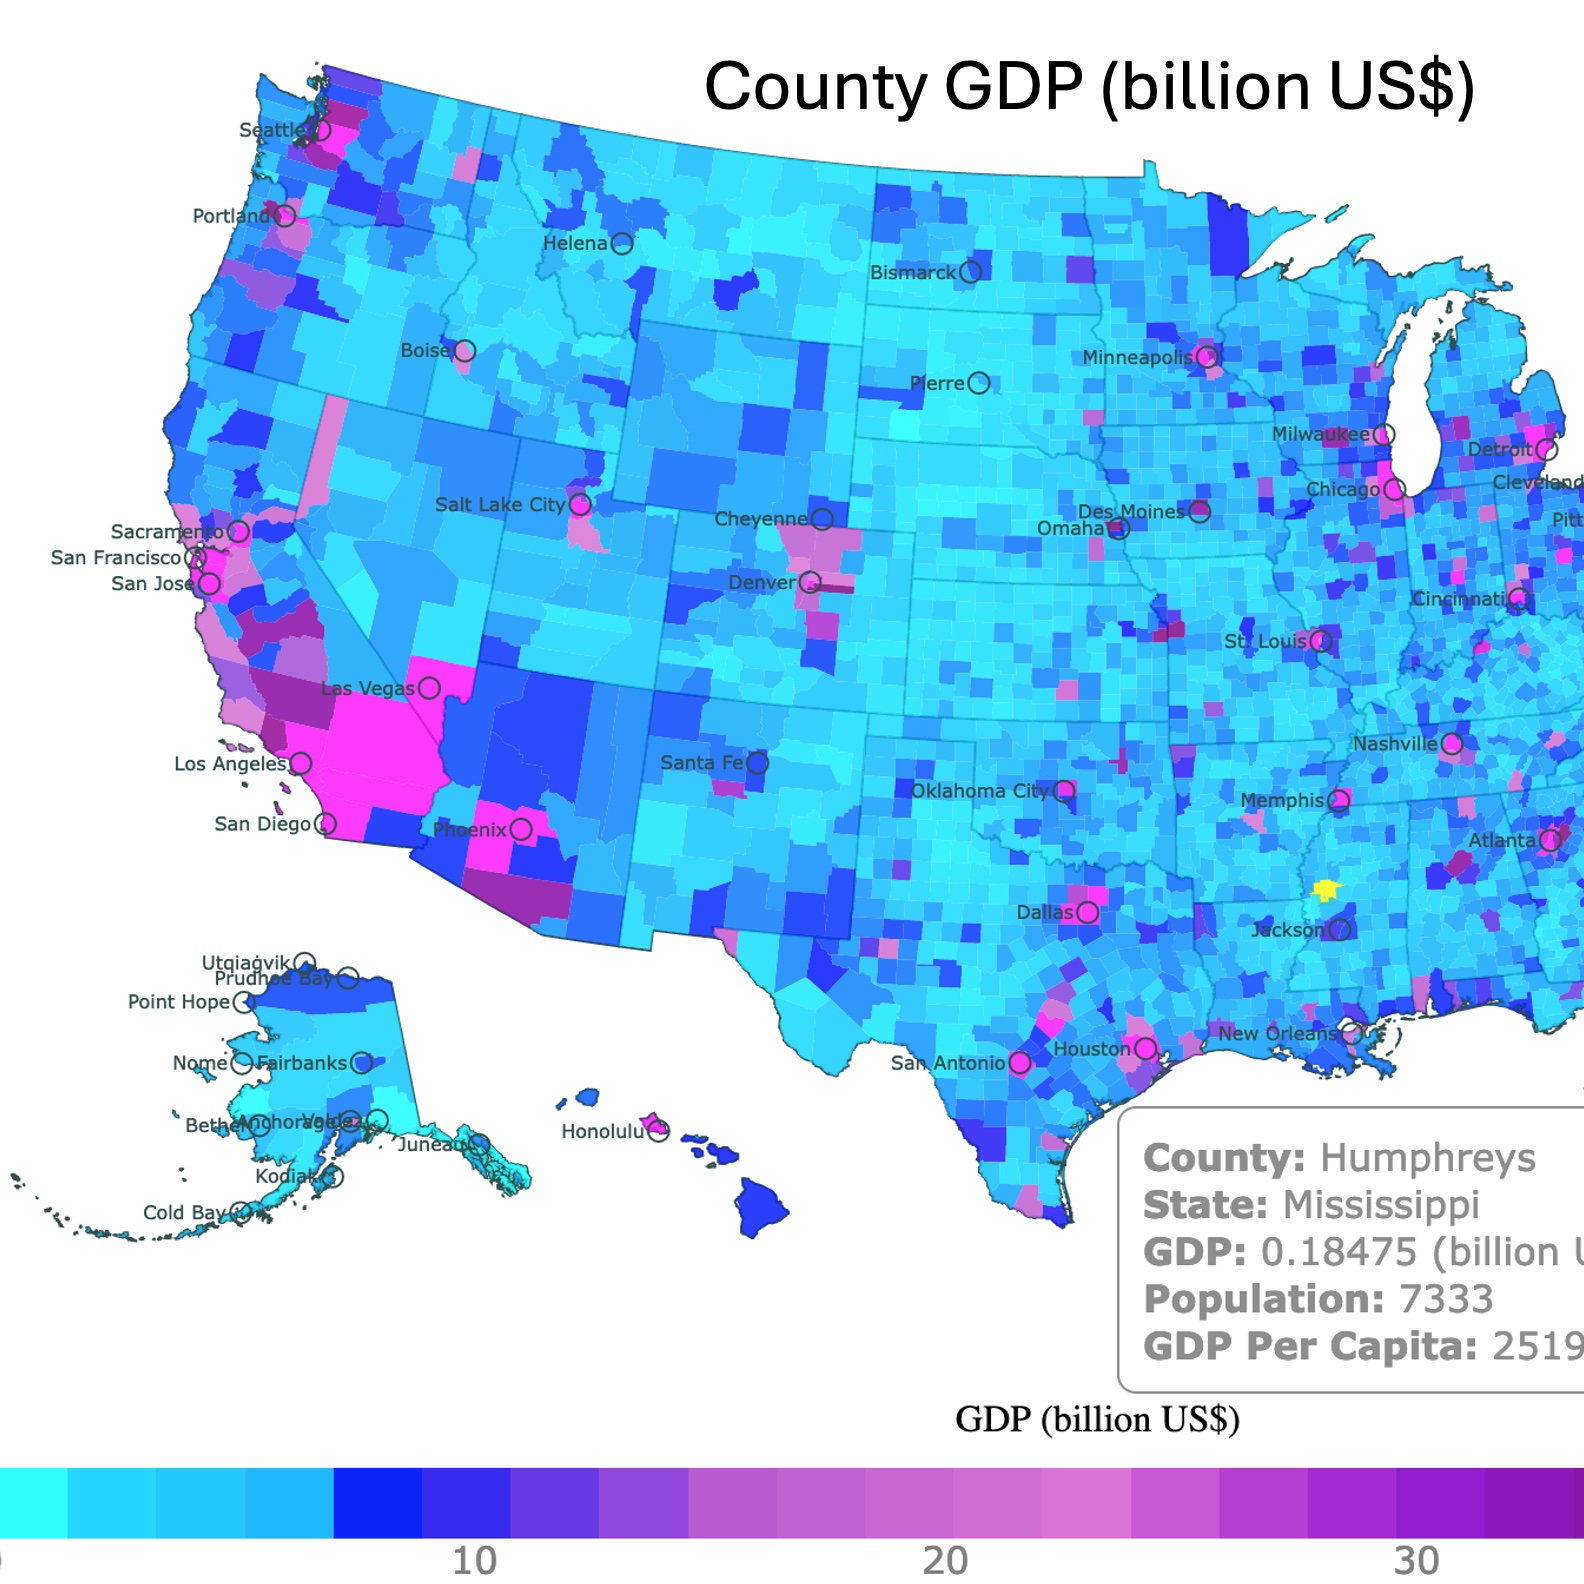
Map of GDP and Per Capita GDP in the United States
U.S. Highest Median Income Counties
Loudoun, Virginia: $153,716
Loudon County has the highest median household income of the whole nation.
Loudon is part of the Washington–Arlington–Alexandria, Metropolitan Statistical Area.
As mentioned in Most Educated Counties in the U.S., this area is also one of the places with highest percentage of PhD's in the nation.
Loudon is the headquarter for high tech companies like Verizon, Telos, Dulles, and Orbital Sciences Corporation, plus several data centers.
Santa Clara, California: $141,161
Santa Clara is part of the larger San Jose Sunnyvale Santa Clara metropolitan area. Close to the San Francisco Bay area.
This county is home to Silicon Valley. Santa Clara is also home to an extraordinary array of high-tech companies, including Applied Materials, Apple, Google, Adobe, Intel, Nvidia, Oracle, and Ericsson. Source: Santa Clara.
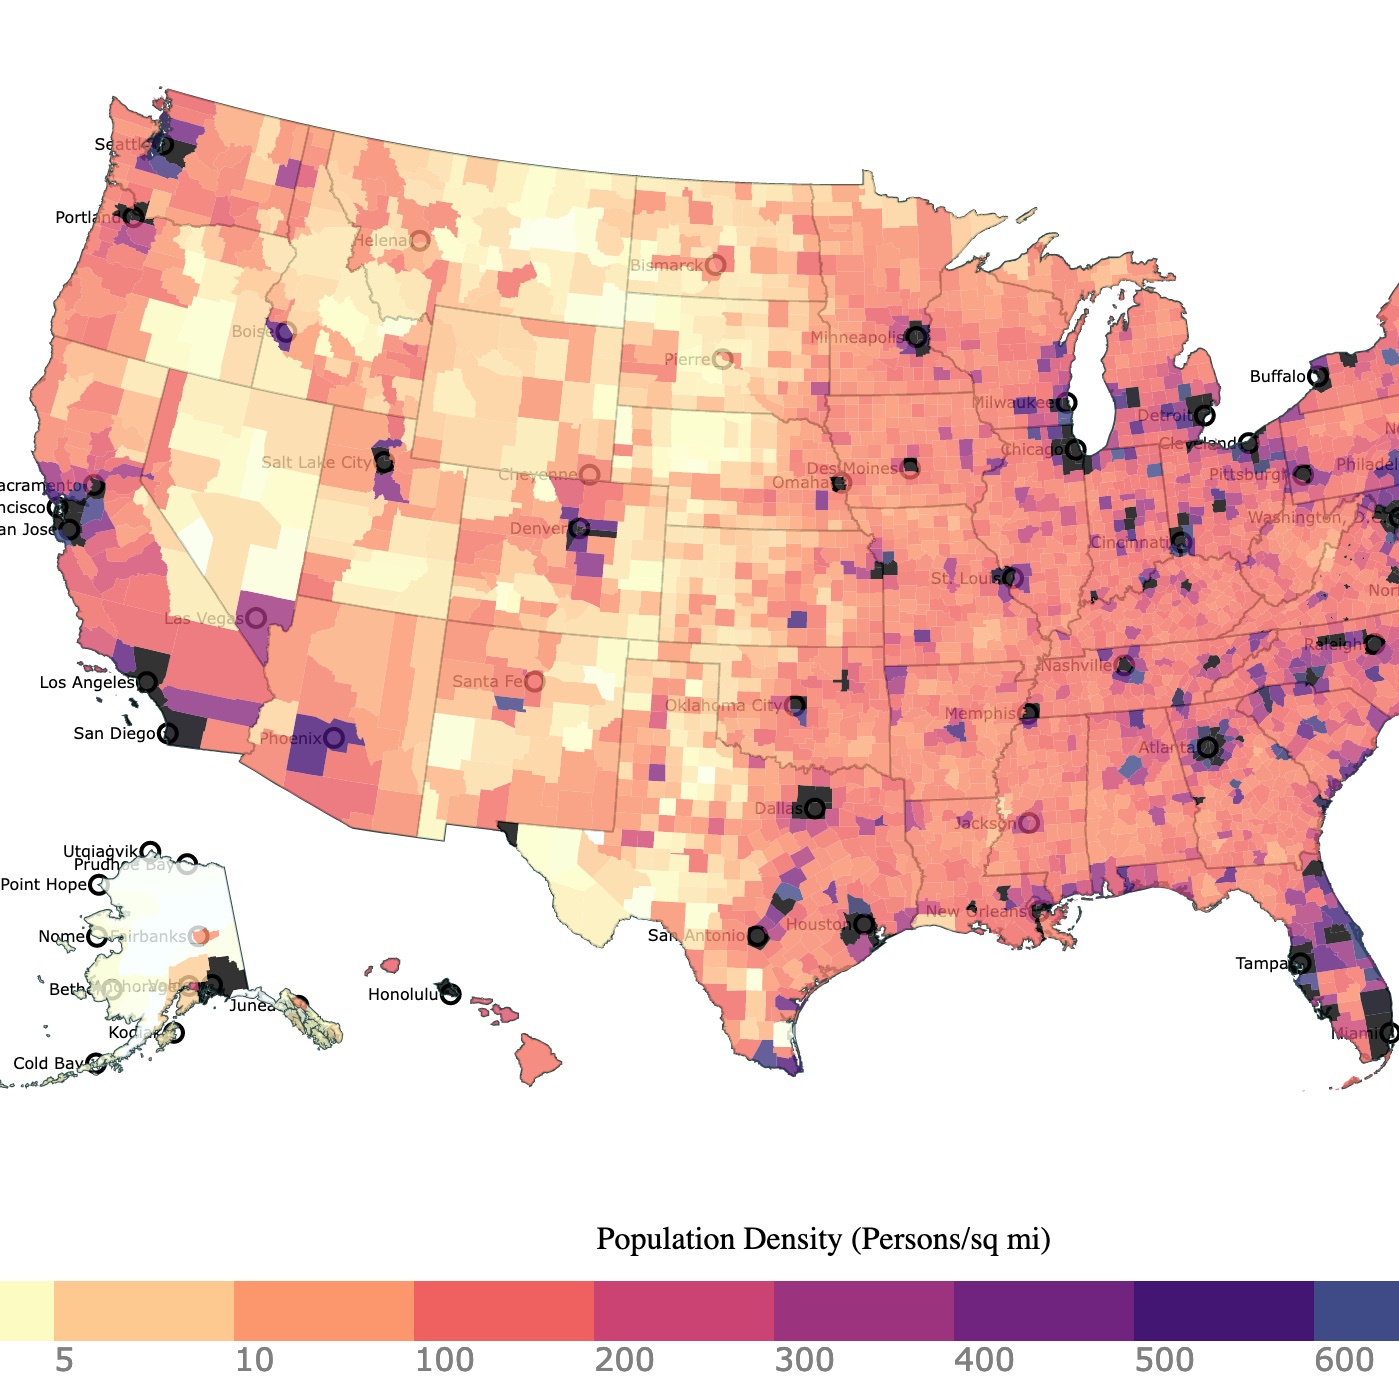
Map of Population Density by County in the United States
Los Alamos, New Mexico: $134,05
Los Alamos County economic landscape is intertwined by the presence of the Los Alamos National Laboratory (LANL).
Established in 1943 as a top-secret facility for developing the atomic bomb.
Since then, it has turned into a multidisciplinary research powerhouse, spearheading advancements in nuclear security, renewable energy, astrophysics, and more. Source: LANM.
Fairfax, Virginia: $133,845
Fairfax has the benefit of being close to Washington D.C. It also has the advantage of having major companies like Inova Health System, Amazon, Booz Allen Hamilton, Capital One, Freddie Mac, General Dynamics, Navy Federal Credit Union and more.

Map of Home-to-Income Ratio by County in the USA
Howard, Maryland:$131,412
Howard is pard of the Baltimore, Columbia Towson Metropolitan area, not far from Washington D.C.
According to Commerce Maryland "It is at the center of the growing cyber security industry due to proximity to Fort George Meade, U.S. Cyber Command and National Security Agency. The county is also home to major research institutions such as Johns Hopkins Applied Physics Lab and companies like W.R. Grace, Merkle, Tenable Network Security, Medstar, and Maxim Healthcare Services."
These high median income counties are followed by San Mateo, CA, Douglas County, CO, Nassau, NY, and Arlington, VA.
U.S. Lowest Median Income Counties
Buffalo SD: $25,253
Holmes MS: $28236
McDowell, WV: $ $28,720
Issaquena, MS: $29,050
Lee, Kentucky: $29,143
Most of these low income counties are located in the south. Buffalo is located at the north but it is characterized for containing part of an American Indian Reservation.
These are mainly rural communities, and high unemployement rates. Source: 247.
Besides the highest and lowest income there are several counties with high income in unexpected areas. Can you see them? Explore the map. Tell me what you think!!
Follow Me
Resources for United States Map
The Shapefiles for the states were downloaded from Natural Earth.
The county shapefiles and the population data were downloaded from the US Census Bureau.
The U.S. population and median income data was obtained from USDA.
Made by Luz K. Molina with D3.js.
This map will be updated with improved and recent information! To receive updates on this and more nature maps, join my email list!!!!!!!
