Map of Population and Population Density in the U.S.
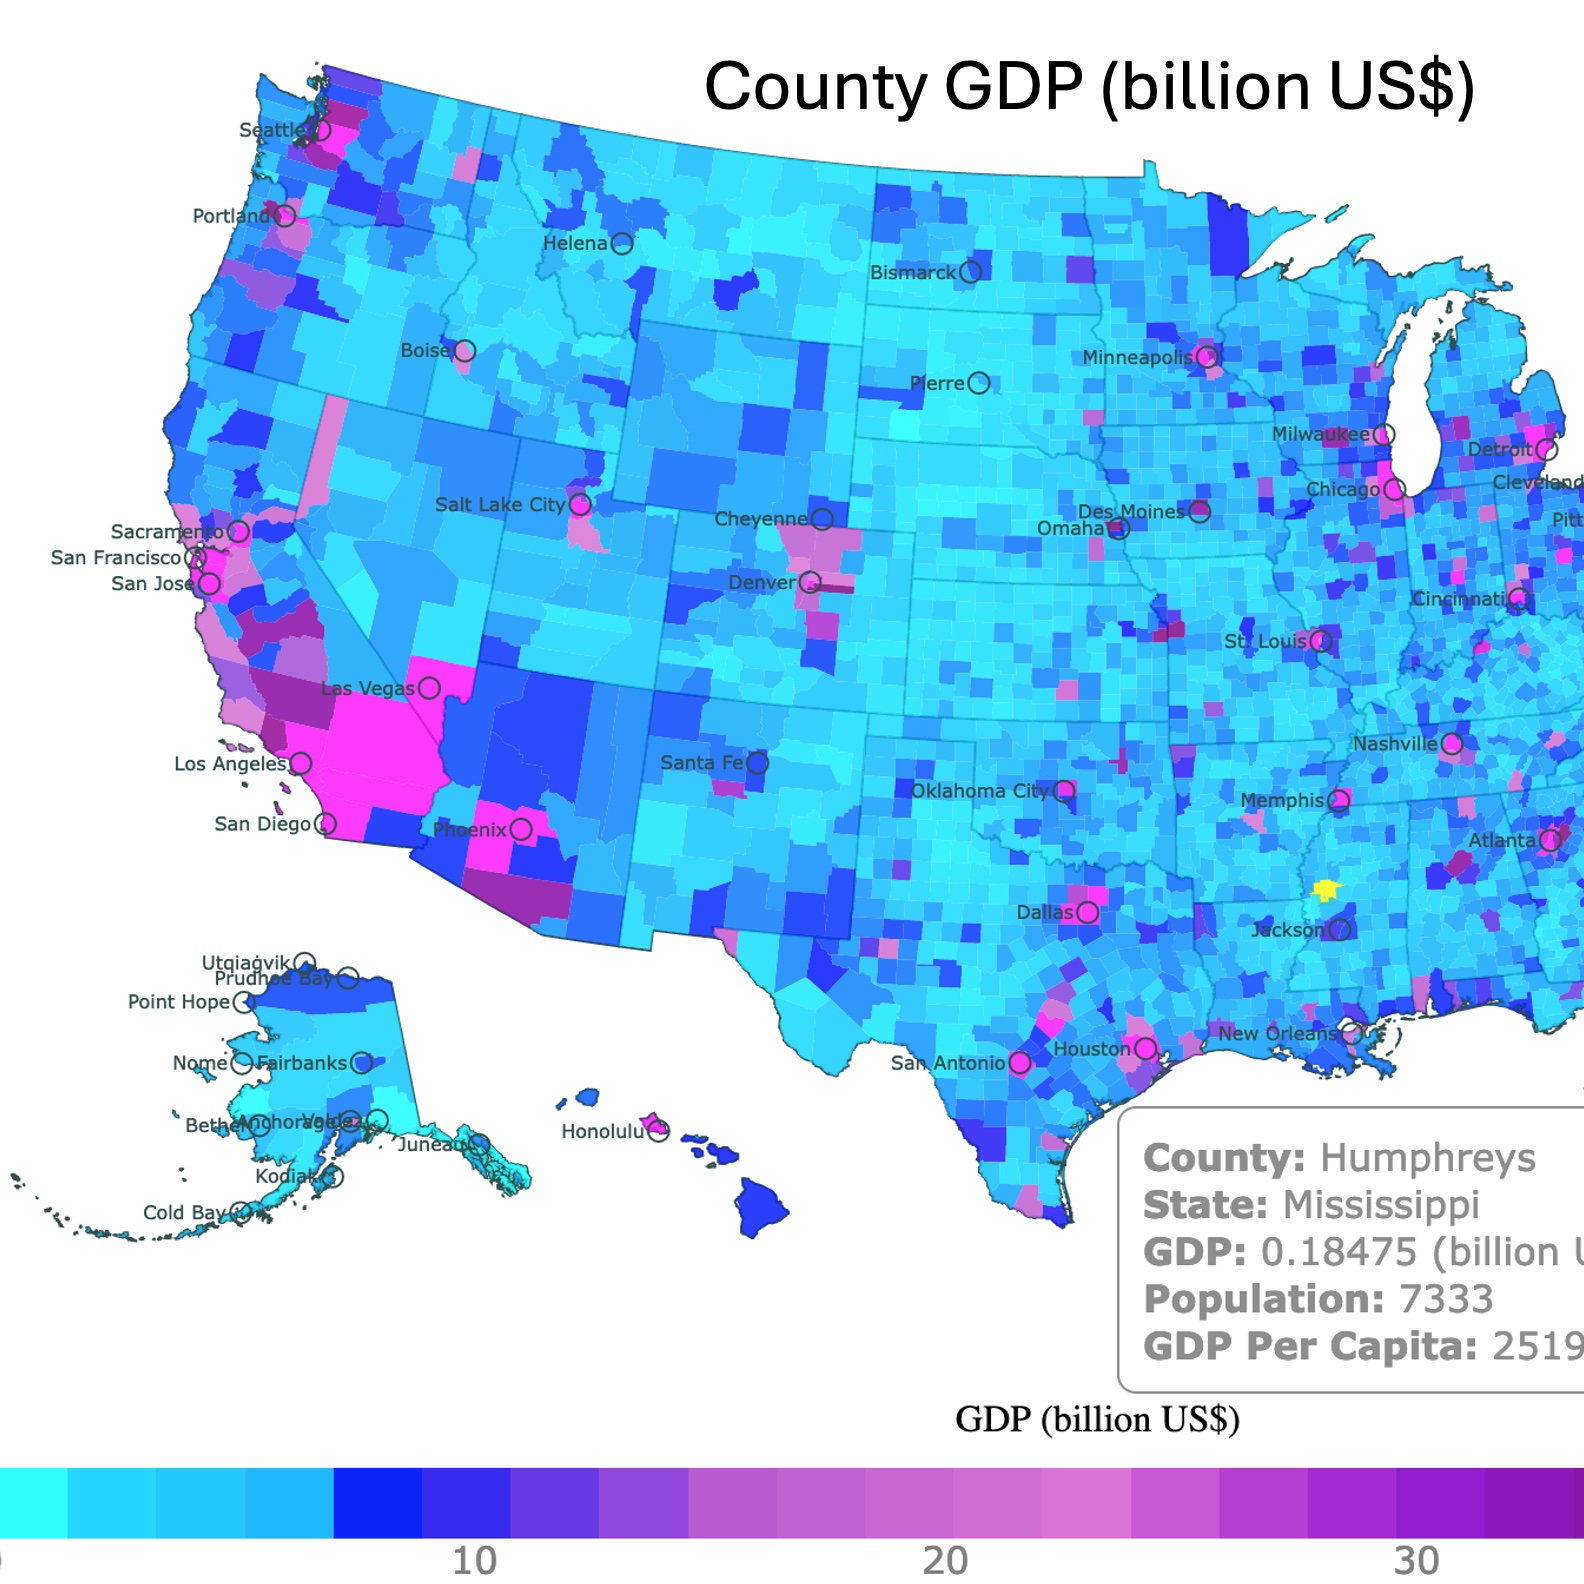
This is an interactive map of the U.S. County Population Density and County Population in the U.S. counties. Yellow shades represent lower population density (persons/sq mi). Dark blue represents higher population density. If you click on the top button you can switch to Population. Yellow represents lower populations in each county. Purple represents higher inhabitants. The cities are depicted for context. Hover over the map to see the county, state, population density and population. Zoom in for more details. Scroll down for more information.
U.S. Population Density
The United States population is of 333,287,557 persons. It includes the non-contiguous states of Alaska and Hawaii. It also includes the U.S. Territories of Puerto Rico and American Samoa.
The U.S. population is an estimate from 2022 obtained from USDA.
Population density is calculated by dividing the number of people by the area of each county.
The population density of the United States is 96 people per sq mi.
It is clear from the map that the most densely populated counties are metropolitan counties. These counties are mainly in coastal areas and lake regions.
Breaking the trend of coastal regions, you can see cities in Colorado, Texas, and even Oklahoma.
One of the interesting things about this map is that not only well known cities are darker, but other areas are dark as well.
For example the east corner of Texas is highly populated. This is El Paso Texas.
As you look through the map you can discover more and more cities you probably have heard of but were not aware they were so densely populated.
Counties with the Highest Population Density
Most of these counties are in or surrounding New York city.
| County | Population Density (persons/sq mi) |
|---|---|
| New York County, NY | 70,455 |
| Kings County, NY | 37,343 |
| Bronx County, NY | 32,817 |
| Queens County, NY | 20,942 |
| San Francisco County, CA | 17,251 |
| Hudson County, NJ | 15,228 |
Counties with the Lowest Population Density
The lowest population density counties are mainly in Alaska.
| County | Population Density (persons/sq mi) |
|---|---|
| Yukon-Koyukuk, AK | 0 |
| Lake and Peninsula, AK | 0 |
| Yakutat, AK | 0 |
| North Slope, AK | 0 |
| Denali, AK | 0 |
| Northwest Arctic, AK | 0 |
| Esmeralda, AK | 0 |
U.S. Population
Population density is affected by the size of the county. When you look at just population you find that they are not on the east coast but throughout the U.S.
As the map shows in yellow the least populated counties are in the Midwest.
Most Populated U.S. Counties
| County | Population |
|---|---|
| Los Angeles, CA | 70,455 |
| Cook, IL | 37,343 |
| Harris, TX | 32,817 |
| Maricopa, AZ | 20,942 |
| San Diego County, CA | 17,251 |
| Miami-Dade, FL | 15,228 |
If you find demographic topics fascinating, Amazon has Demographic Deception: Exposing the Overpopulation Myth and Building a Resilient Future. This book explores big demographic issues and their intersections with other global forces.
Least Populated U.S. Counties
| County | Population |
|---|---|
| Loving, TX | 51 |
| Kalawao, HI | 82 |
| King, TX | 233 |
| Kenedy, TX | 358 |
| McPherson, NE | 372 |
| Arthur, NE | 433 |
| Blaine, NE | 453 |
Follow Me


Resources for United States Map
The Shapefiles for the states were downloaded from Natural Earth.
The county shapefiles and the population data were downloaded from the US Census Bureau.
The U.S. population data was obtained from USDA.
Made by Luz K. Molina with D3.js.
This map will be updated with improved and recent information! To receive updates on this and more nature maps, join my email list!!!!!!!


