Natural Hazard Risk Map by U.S. County
This is an interactive map of Natural Risk Index Score by U.S. county. Each hue represents the predominant Natural Risk by county. Hover over the map to see the county, state, population, and specific index score. Zoom in for more detail. Scroll down for more information.
Natural Hazards
Natural Hazards Risk Index
"All communities in the U.S. experience natural hazards, and there is a wide range of environmental, social, and economic factors that influence each community’s risk to natural hazards.
The likelihood that a community may experience a natural hazard can vary drastically, as can the associated consequences".
The National Risk Index is a dataset to help illustrate the U.S. communities most at risk for 18 natural hazards.
It was designed and built by FEMA (Federal Emergency Management Agency) in close collaboration with various stakeholders and partners in academia; local, state and federal government; and private industry. Source: FEMA.
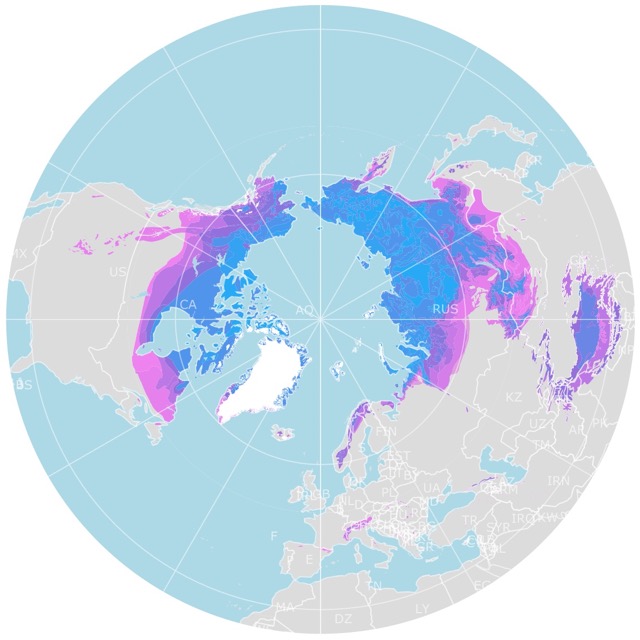
Map of Arctic Permafrost
Risk Index Map
This map displays the main risk for each county but the tooltip also displays the overall risk and the value for each natural hazard.
At first it is hard to notice any pattern, but if you look closely some trends are visible.
If you want to learn more about Natural Hazards, Amazon has Natural Hazards: Earth's Processes as Hazards, Disasters, and Catastrophes. This book adresses earth processes that have direct, and often sudden and violent, impacts on human society.
The text integrates principles of geology, hydrology, meteorology, climatology, oceanography, soil science, ecology, and solar system astronomy.
Hurricane Risk
Hurricanes are quite prevalent, and the coastal exposure is visible on the Atlantic and the Gulf Coasts.
As a Marine Scientist I always wondered why people lived in Hurricane prone areas.
And here I am paying home insurance in the Emerald Coast...
Tornado Risk
Apparently Tornado Alley has more things to worry about besides tornadoes.
Tornadoes occur throughout most of the Midwest and the Southeast but it is the main hazard in Northern Alabama and scattered around the rest of the country.
Surprisingly counties in the South are at risk of strong Wind.
Hail Risk
It is striking to see that the middle of the country, mainly Kansas and Nebraska are greatly affected by hail!
Wildfire Risk
The West and South West is at great risk of Wildfires.
But so are many other counties including Central Florida.
Winter Related Risks
As a Florida resident I tend to fantasize about a white Christmas. Unfortunately that is not the reality of many Northern counties where a Cold Wave or an Ice Storm might turn into a nightmare.
Skiing in Colorado or Wyoming sounds like fun, but the risk of an avalanche is quite high in some of their counties.
Lightning Risk
What are the odds! But lightening is prominent in several areas!
I am used to stories of electronics being burned by lightning.
In Florida it just means no swimming or playing in the rain, or so I thought.
Landslide Risk
I don't recall seeing many news about landslides. But from this map they are definitely common. Even in Vermont.
Less Common Natural Hazards
What is amazing is that a country like the United States not only has ice storms and heat waves, but also risk of volcanic activity.
This is the case in King county Washington.
Meanwhile Hawaii's Maui and Honolulu are at risk of Tsunamis.
Follow Me
Resources for Natural Hazards Risks Map
The Shapefiles for the states were downloaded from Natural Earth.
The county shapefiles and came from US Census Bureau.
The data was dowloaded from FEMA.
Made by Luz K. Molina with D3.js.
This map will be updated with improved and recent information! To receive updates on this and more maps, join my email list!!!!!!!
