Map of Tropical Cyclone Tracks
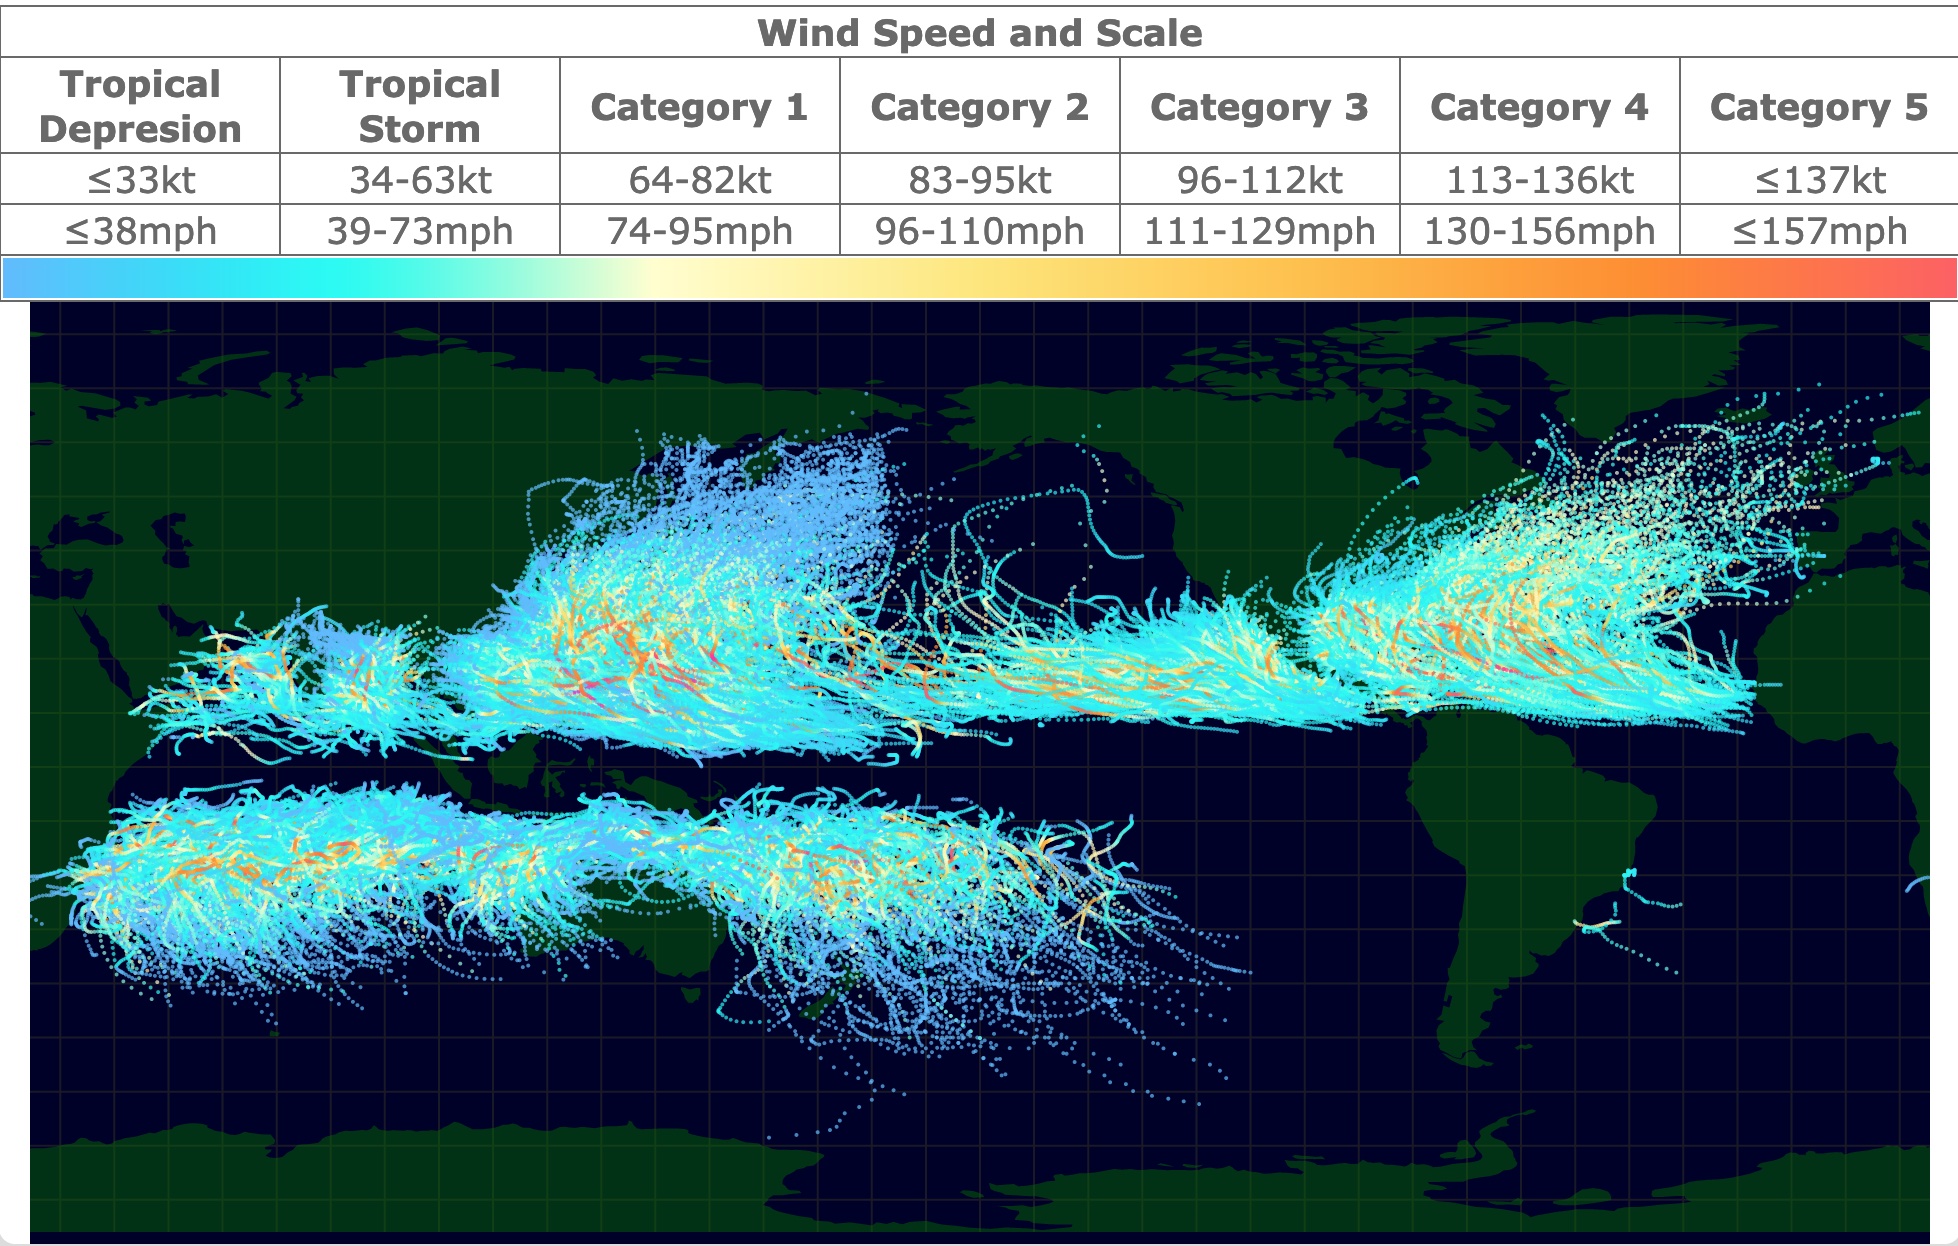
This is an interactive map of Tropical Cyclone Tracks. It provides the location and intensity of global tropical cyclones since 2000. For name, year, wind scale, and wind speed, hover over the map. Zoom in to see tracks in detail.
| Wind Speed and Scale | ||||||||
|---|---|---|---|---|---|---|---|---|
| Tropical Depresion | Tropical Storm | Category 1 | Category 2 | Category 3 | Category 4 | Category 5 | ||
| ≤33kt | 34-63kt | 64-82kt | 83-95kt | 96-112kt | 113-136kt | ≤137kt | ||
| ≤38mph | 39-73mph | 74-95mph | 96-110mph | 111-129mph | 130-156mph | ≤157mph | ||
Tropical Cyclones
Tropical Cyclones are rapidly rotating storm systems defined by closed low-pressure centers, strong winds, and a spiral organization of thunderstorms.
They are warm-core cyclones with a defined center that extract energy from the ocean at high temperatures.
They are referred to as tropical storms, tropical cyclones, or tropical depressions.
The main risks related to tropical cyclones are:
- Coastal Storm Surge
- High Winds and gusts
- Torrential rainfall and flooding
- Tornadoes
- Rip Currents
In case you want to read more about hurricanes Amazon has an excellent book on the topic. Hurricane Risk in a Changing Climate is a comprehensive look at cyclones in a changing climate. It presents novel approaches to integrate science with risk assessment.
Tropical Cyclone Formation
When air is heated on warm tropical seas, the warm air rises rapidly under low-pressure conditions. Rising air draws more moisture resulting in strong winds.
The Coriolis effect, caused by Earth's rotation, makes the air deflect, circulating counterclockwise in the Northern Hemisphere and clockwise in the Southern Hemisphere.
Therefore, the Coriolis effect makes the air spin upwards around a calm central area called the eye of the storm.
The Coriolis effect is null in the equator. Even though there are strong storms along the equator, the rising air does not spin. Therefore, there are no cyclones forming at latitude 0, which is confirmed on the map above.
As the air rises, it cools and condenses, forming high cumulous clouds. These clouds form heavy rainfall.
Cold air sinks in the eye. Here there are no clouds and the air is dry and calm.
Tropical cyclones travel over the oceans by prevailing winds. Once the storm reaches land, it is not fuelled by the ocean's heat. It loses its energy source and weakens. Source: Intergeography.
Atmospheric Science requires various skills and the analysis of big data. Coursera offers a specialization on Deep Learning that you can use in different fields of sicence and technology. For more information go to THIS LINK!

Tropical Cyclone Geography
Tropical Cyclones originate over tropical or subtropical waters. Between 5° and 30° north and south of the equator, where surface sea temperature is at least 79.7°F (26.5°C).
Depending on the location, tropical cyclones have different names.
The term hurricane is used in the Atlantic.
In the Northwest Pacific, they are called Typhoons. In the South Pacific and Indian Ocean, they are called tropical cyclones.
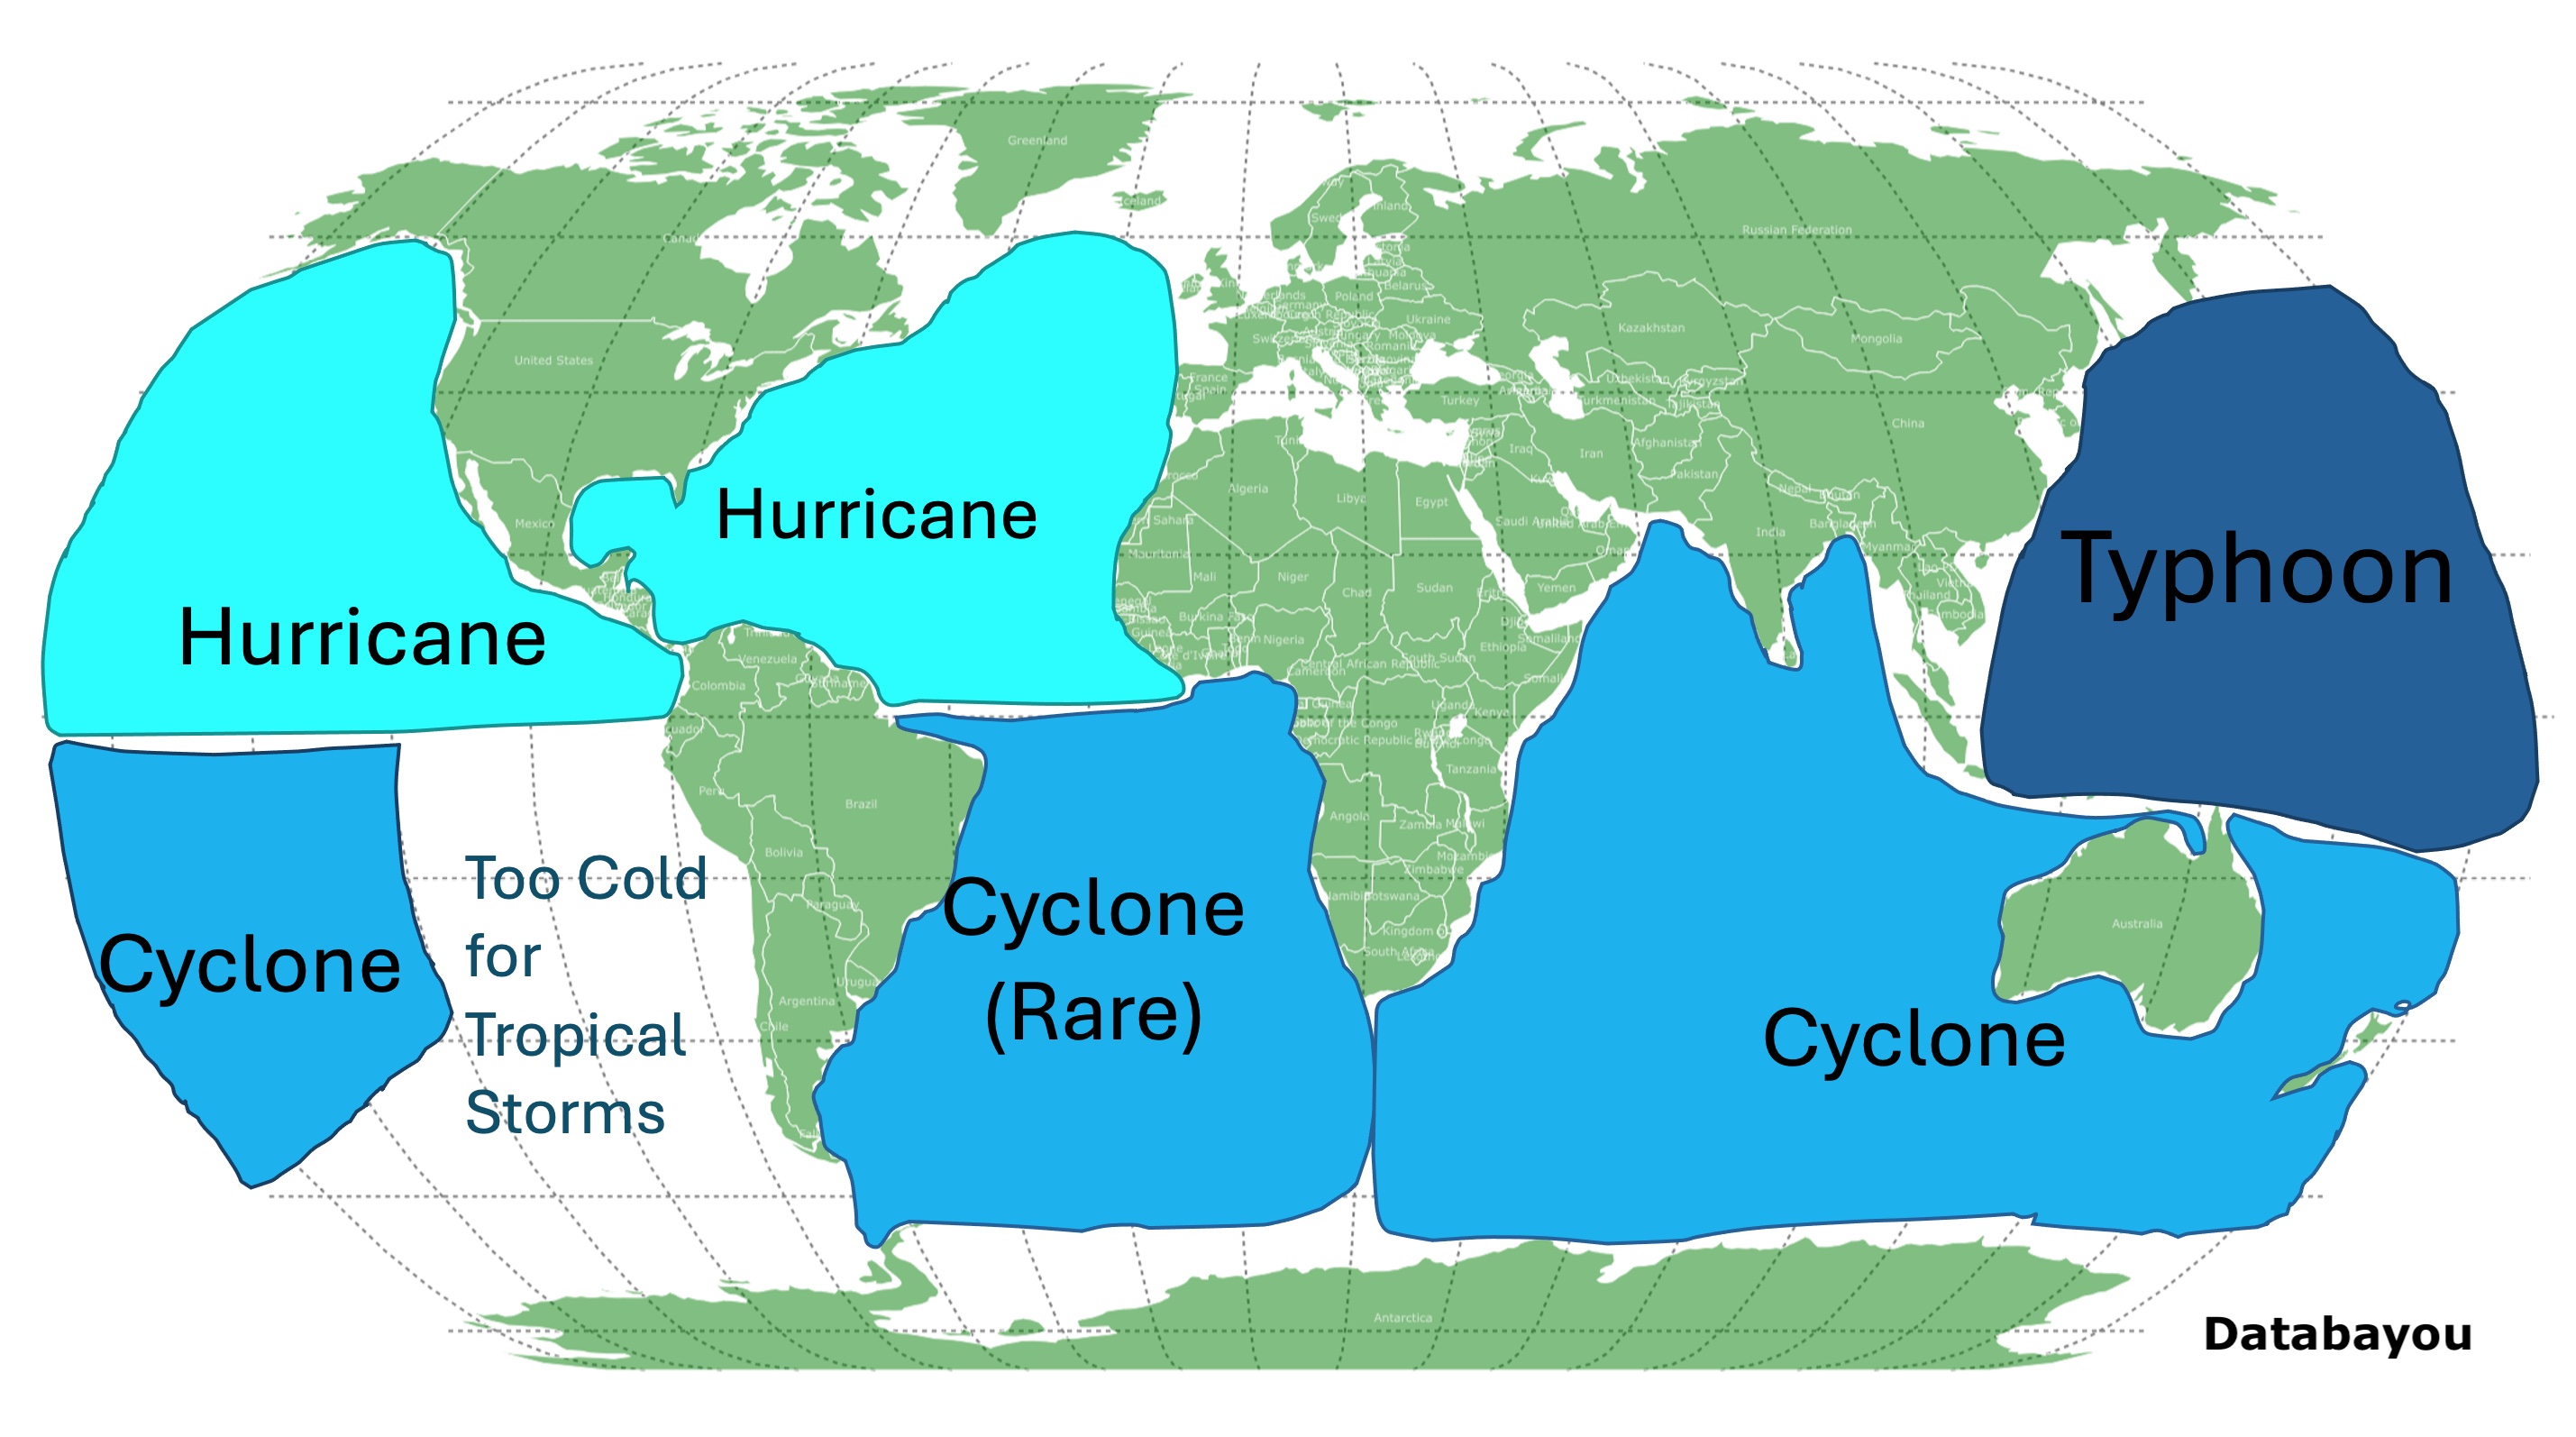
Typhoons travel in a westerly or north-westerly direction. They often pass over the Philippines and land in South East China, Korea, or Japan. They are likely influenced by factors like El Niño or La Niña.
It is evident on the map that there are no tropical cyclones in the South Pacific west of South America. This is because the Peru Current that runs along Chile, Peru, and Ecuador brings cool waters from the southern pole as well as the upwelling of cold bottom waters below.
These cold waters prevent the sea surface from reaching the warm temperatures required for a tropical cyclone.
A similar cold current flows along the western coast of South Africa, Namibia, and Angola. These cool waters also prevent the formation of cyclones.
The lack of cyclones in the South Atlantic along Brazil are due to different reasons. These include a variation in wind speed and direction at different altitudes. This is the norm except for rare exceptions seen on the map.
From the map, it is also visible that easterly winds dominate cyclones in the tropics. In mid-latitudes, westerly winds are more common NASA.
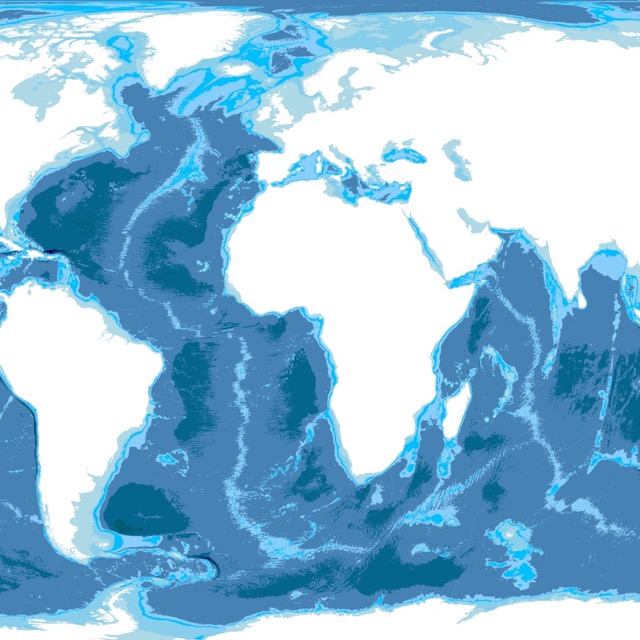
Map of Ocean Depth Map
Storm Seasons
These are the times of year storms are most likely to happen.
Hurricane Season
The Atlantic Hurricane Season is the time of year with a higher occurrence of hurricanes. The hurricane season in the Caribbean, Gulf of Mexico, and North Atlantic start on June 1st to November 30th.
Ninety-seven percent of tropical cyclone activity in the North Atlantic occurs during this time period.
They have occurred earlier or later on rare occasions, but these are very odd occurrences.
Each month of the hurricane season, there is a more likely area of formation. Source: FSU.
For example, they are more likely to form in the Gulf of Mexico in June. In August, they are more likely to develop in the Caribbean.
Typhoon Season
Typhoon Season is between April and December.
Cyclone Season
Tropical Cyclones generally occur between November and April in the South Pacific.
Saffir-Simpson Hurricane Wind Scale
The Saffir-Simpson Hurricane Wind Scale is a rating based on a hurricane's maximum sustained wind speed. It classifies tropical cyclones with sustained winds over 63 knots into five categories.
The scale was developed in 1971 by Herbert Saffir a civil engineer, and meteorologist Robert Simpson. At the time, R. Simpson was the director of the National Hurricane Center.
The Central Pacific Hurricane Center, the Joint Typhoon Warning Center, and the U.S. National Weather Service define sustained winds as the average winds over a period of one minute, measured at 33 ft (10.1 m) height. These are the same factors used for the Saffir-Simpson Scale.
The measurements are taken using satellite imagery when far out at sea. Closer to land, the measurements are taken by the "hurricane hunter". This is a specially equipped NOAA aircraft that collects meteorological data.
This scale is roughly logarithmic. So a Category 2 storm may produce 10 times the damage of a normal Category 1. Source: Skybrary.
The scale does not consider deadly dangers like rainfall flooding, storm surge, and tornadoes. It estimates the possible property damage.
Hurricanes rated Category 3, or higher are known as major hurricanes. In the western North Pacific, the term "Super Typhoon" is used for tropical cyclones with sustained winds over 150mph.
Hurricanes reach different wind speeds but are usually remembered for their landfall category.
Tropical Depressions and Tropical Storms are not included in the Saffir-Simpson scale but are included in the map and the key above.
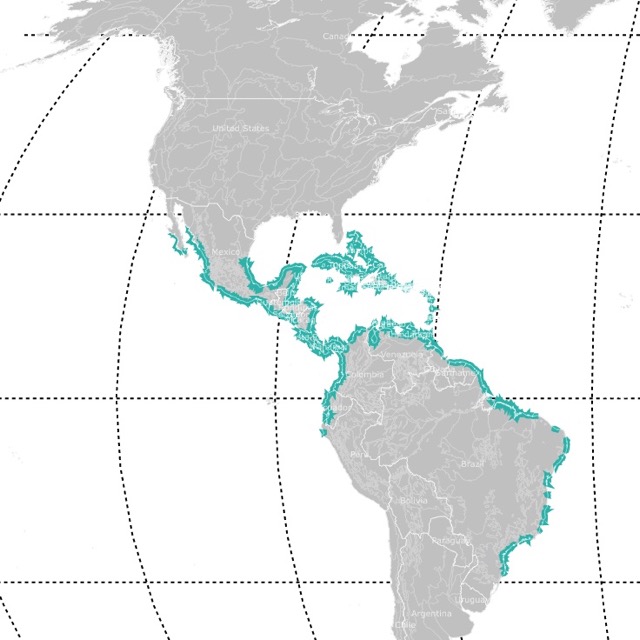
The best coastal protection in tropical areas are Mangrove Forests. This map will show you where Mangrove Forests are located.
Tropical Depression
This is a tropical cyclone with a maximum sustained surface wind speed of 33 kt (38 mph or 62 km/hr) or less.
Tropical Cyclone
A tropical cyclone with maximum sustained surface wind speed ranges from 34 kt (39 mph or 63 km/hr) to 63 kt (73 mph or 118 km/hr).
Category 1
Winds of 74-95 mph (64-82 kt or 119-153 km/hr). Very dangerous winds will produce some damage.
Damage to roof, shingles, and gutters. Large branches of trees will snap. Extensive damage to power lines.
Hurricane Sandy made landfall as a Category 1. To read more about this storm, Amazon has a compelling book about it called Storm Surge: Hurricane Sandy, Our Changing Climate, and Extreme Weather of the Past and Future. The book explains the remarkable atmospheric conditions that gave birth to Sandy and determined its path. It also gives us insight into the sophisticated science that led to the forecasts of the storm.
Category 2
Winds between 96-110 mph (83-95 kt or 154-177 km/hr). Extremely dangerous winds will cause extensive damage.
Homes roof and siding may damage. Shallow rooted trees will be uprooted. Total power loss expected.
Hurricane Erin was a Category 2 that struck Florida and Georgia in 1995.
Category 3
Winds about 111-129 mph (96-112 kt or 178-208 km/hr). Devastating damage will occur.
Removal of roof and decking. Trees snapped and uprooted, blocking roads. Power poles downed.
Katrina was a well-known hurricane Category 3 that made landfall in Mississippi and Louisiana in 2005. At least 1,836 people died in the actual hurricane and subsequent floods.
Katrina was a category 1 when it initially made landfall in Florida. It reached category 5 on the Gulf of Mexico and slowed down before hitting the Mississippi Coast.
Category 4
Winds between 130-156 mph (113-136 kt or 209-251 km/hr). Catastrophic damage will occur.
Homes may lose roof structure and walls. Most trees will be uprooted or snapped. Power poles downed. Power outages will last weeks or even months. The area will be uninhabitable for weeks or months.
An example of a Category 4 is the Great Galveston Hurricane that hit Texas in 1900. It came with a 15-foot storm surge that destroyed at least 3,500 homes and buildings. It killed more than 8,000 people.
Category 5
Winds are 157 mph or higher (137 kt or higher or 252 km/hr or higher). Catastrophic damage will occur.
Framed homes will be destroyed. Power poles downed. Power outages will last weeks or even months. The area will be uninhabitable for weeks or months. Source: NOAA.
Only a few Category 5 storms have ever hit land. An example is Hurricane Andrew, which intensified near the Bahamas and passed over Southern Florida in 1992. Andrew caused $26.5 billion in damage and had 1 million people evacuated.
World Map of Glaciers
Follow Me
Resources for Tropical Cyclone Tracks Map
The Tropical Cyclone Tracks were downloaded from NOAA's International Best Track Archive for Climate Stewardship (IBTrACS) data, accessed on [2023]. It only includes data since 2000.
The Shapefiles for this map were downloaded from Natural Earth. The code was obtained and altered from Chris Williams’s Block.
Made by Luz K. Molina with D3.js.
This map will be updated with improved and recent information! To receive updates on this and more nature maps, join my email list!!!!!!!