Map of Wildfire Risk by U.S. County
This is an interactive map of Wildfire Risk by U.S. County. Light yellow hues represent high wildfire risk. Dark hues represent lower fire risk. Hover over the map to see the county, state, wildfire Risk Index and Score. Zoom in for more detail. Scroll down for more information.
Wildfire Risk Score
Understanding Wildfire Risk Scores in the USA
Wildfires are a growing concern across the United States, especially as their frequency and intensity increases.
To address this pressing issue, wildfire risk scores have become an essential tool for assessing the likelihood of wildfires and their potential impact on communities.
These scores help policymakers, insurance companies, and residents make informed decisions to mitigate risks and protect lives and property.
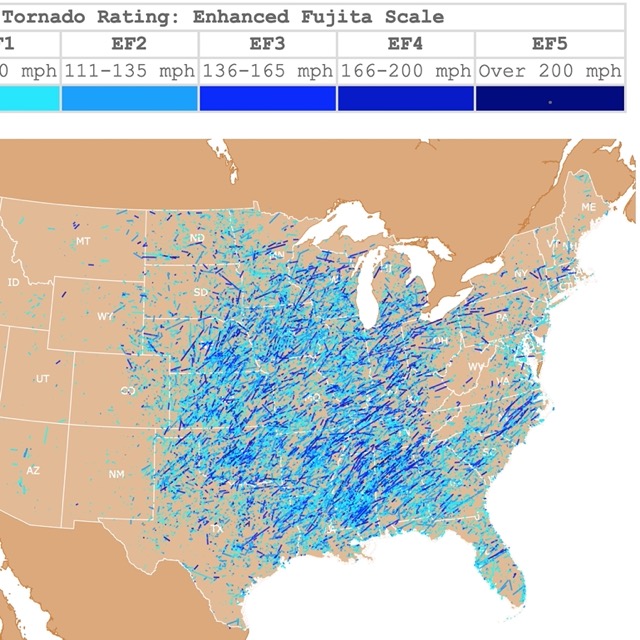
Map of the United States Tornadoes
What Are Wildfire Risk Scores?
A wildfire risk score is a numerical or categorical rating that quantifies the potential risk of wildfire in a specific location.
These scores are derived from a combination of factors, including:
- Vegetation and Fuel Load: The type and density of vegetation in an area determine how quickly a wildfire can spread.
- Climate Conditions: Temperature, humidity, wind patterns, and precipitation play a significant role in wildfire risk.
- Topography: Steep slopes can accelerate the spread of fire, while valleys can trap heat and smoke.
- Proximity to Human Activity: Areas near urban development or recreational areas may face higher risks due to human-caused ignition sources.
- Historical Fire Data: Past wildfire activity provides insights into patterns and likelihood of future events.
Wildfire Risk Extremes
The geographic conditions mentioned before, result in a wide extreme of risks within the United States.
There is lower fire risk in areas close to rivers like the Mississippi River. This is the case of Illinois, and nearby states.
Drier states like California, are more prone to wildfires.
Highest Wildfire Risk
- San Diego, California
- Riverside, California
- San Bernardino, California
- Los Angeles, California
- Washington, Utah
- Elko, Nevada
- Ventura, California
- Orange, California
- Pima, Arizona
- Maricopa, Arizona
Lowest Wildfire Risk
- Aleutians, Alaska
- Scott, Illinois
- Warren, Illinois
- Greene, Illinois
- Covington, Virginia
- Brown, Illinois
- Lawrence, Illinois
- Schuyler, Illinois
- Cameron, Pennsylvania
- Graham, North Carolina
How Are Wildfire Risk Scores Calculated?
Wildfire risk scores are generated using advanced modeling techniques that incorporate geographic information system (GIS) data, satellite imagery, and weather forecasts.
Organizations like the U.S. Forest Service, private analytics firms, and research institutions develop these models to create detailed risk assessments. Some of the most widely used tools and platforms include:
- Wildfire Risk to Communities: Developed by the U.S. Forest Service, this tool provides national-level data to help communities understand and reduce wildfire risk.
- First Street Foundation’s Fire Factor™: This platform offers property-specific wildfire risk scores, enabling homeowners to evaluate their individual risk.
- CAL FIRE's Fire Hazard Severity Zones: Focused on California, this tool maps areas of varying wildfire risks to guide local planning and building standards.
Applications of Wildfire Risk Scores
Wildfire risk scores are applied in various ways to mitigate and manage wildfire risks:
- Urban Planning and Zoning: Local governments use wildfire risk scores to guide land use decisions, such as restricting development in high-risk areas or enforcing building codes that require fire-resistant materials.
- Insurance: Insurance companies rely on wildfire risk scores to set premiums, determine coverage eligibility, and encourage mitigation efforts by policyholders.
- Emergency Preparedness: Risk scores help emergency management agencies prioritize resources, plan evacuation routes, and conduct public awareness campaigns.
- Homeowner Awareness: By understanding their property's risk score, homeowners can take proactive steps such as creating defensible space, installing fire-resistant landscaping, and hardening their homes against fire.
Map of the United States
Follow Me
Resources for Fire Risk Map
The Shapefiles for the states were downloaded from Natural Earth.
The county shapefiles are from US Census Bureau.
National Risk Index for Fire Data was downloaded from FEMA (Federal Emergency Management Agency).
Made by Luz K. Molina with D3.js.
This map will be updated with improved and recent information! To receive updates on this and more maps, join my email list!!!!!!!
