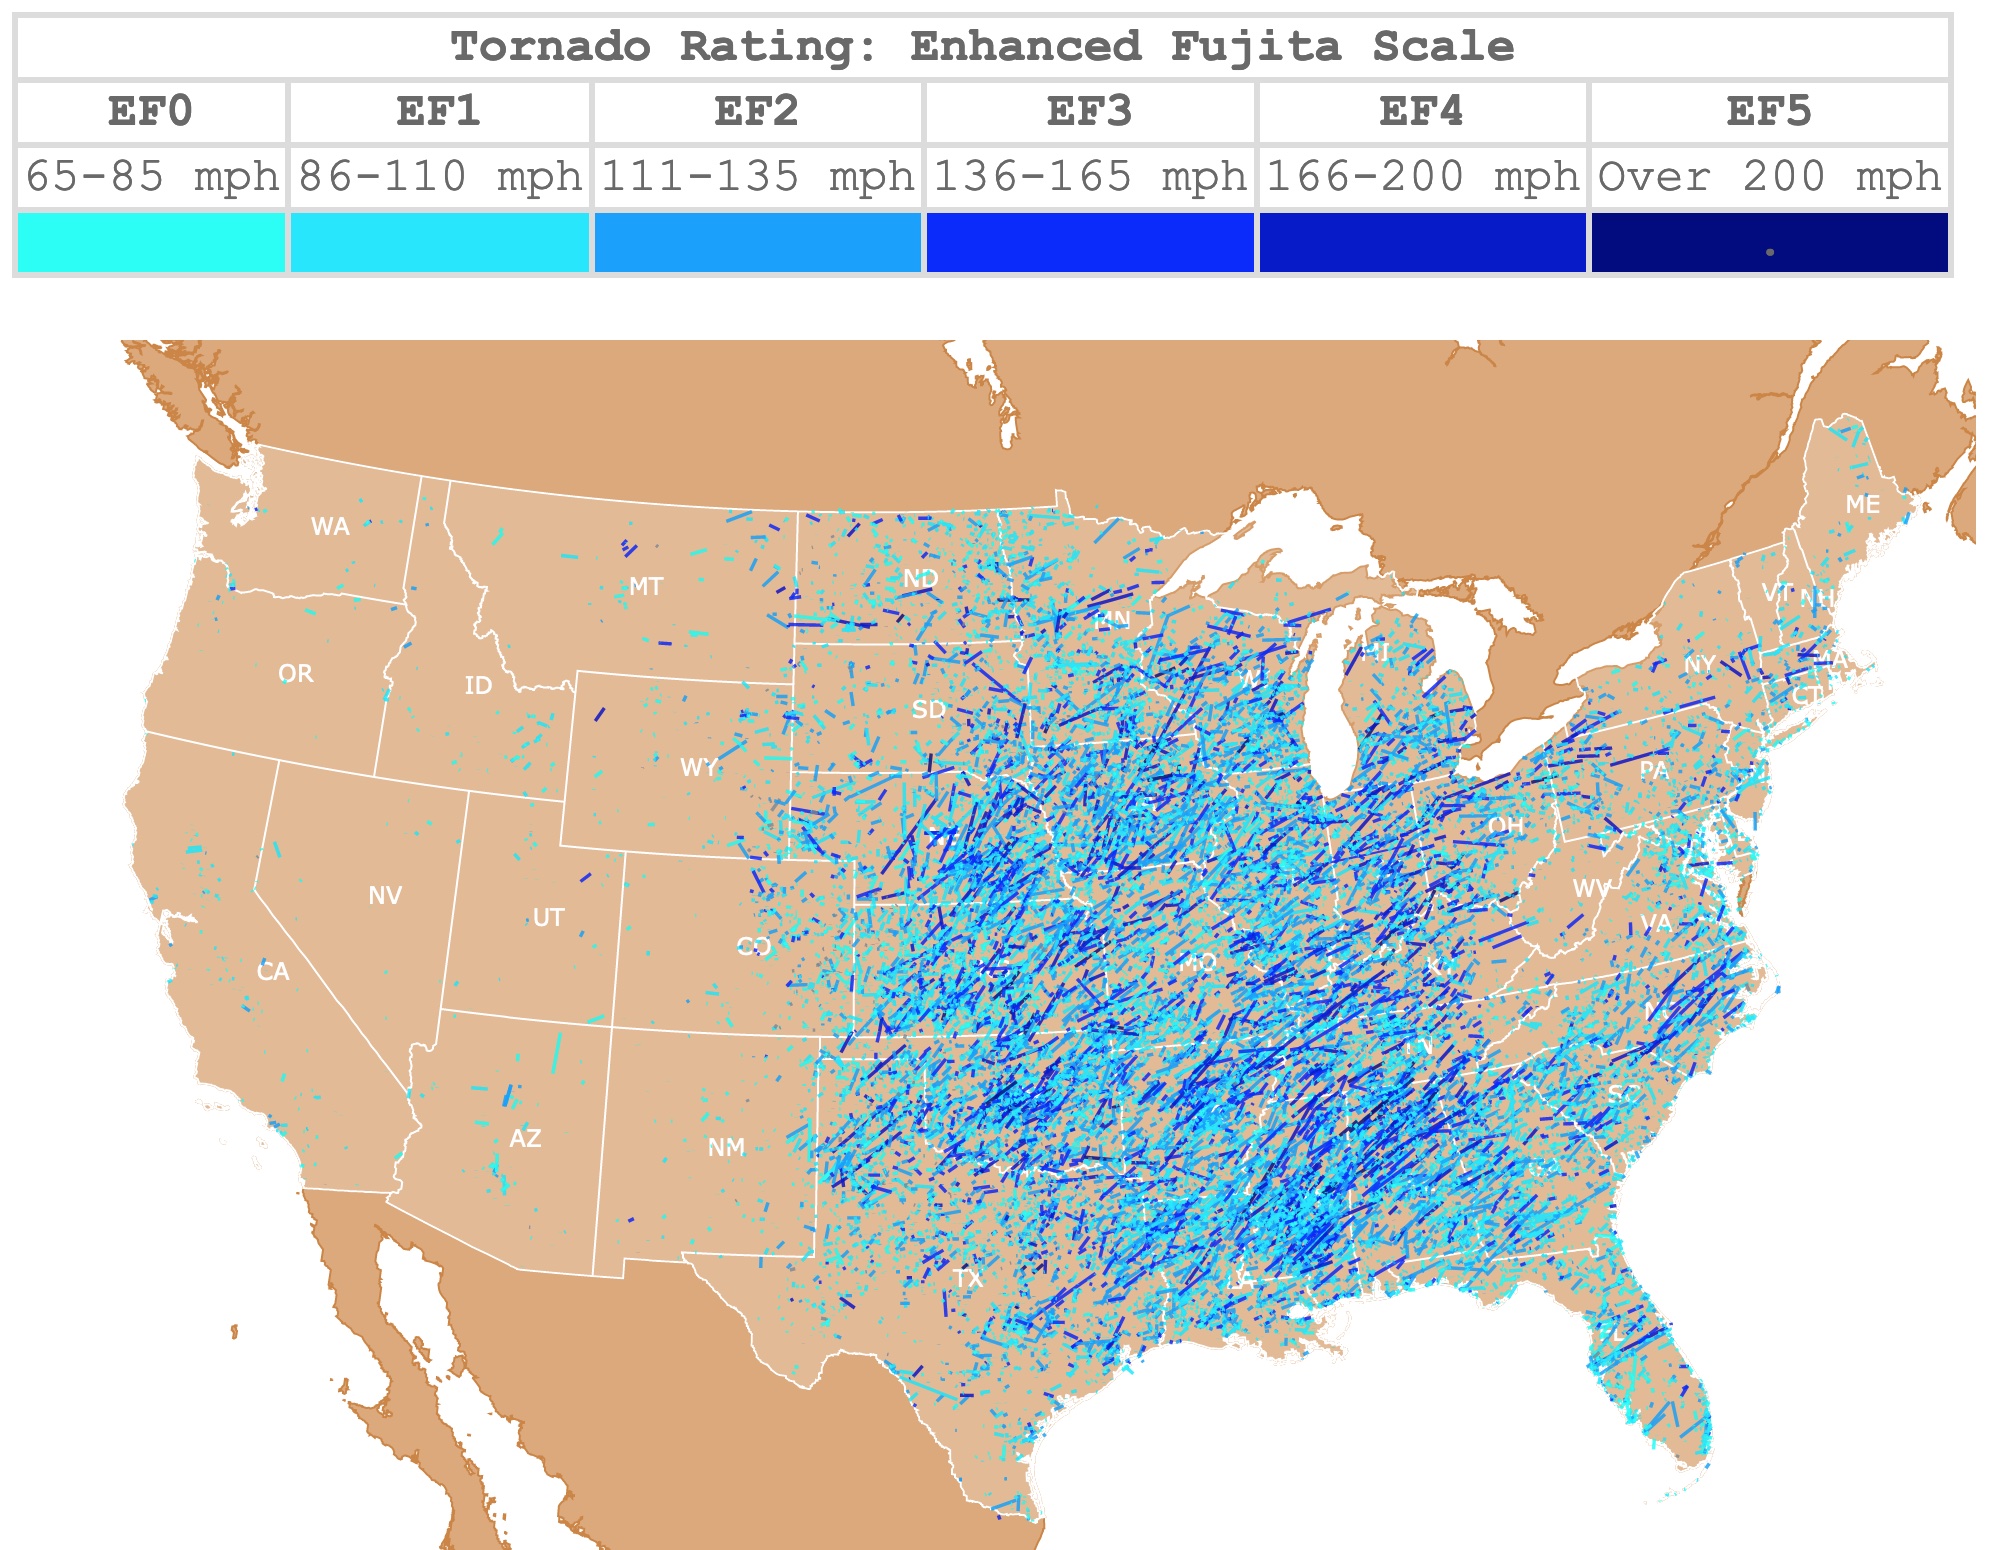
Tornadoes Tracks Map
This interactive map shows the tracks of tornadoes in the United States from 1950 to 2021. Darker shades of blue represent stronger tornadoes. For more detail, zoom in. For magnitude, date, and other facts, hover over the map. For more information, scroll down.
| Tornado Rating: Enhanced Fujita Scale | |||||
|---|---|---|---|---|---|
| EF0 | EF1 | EF2 | EF3 | EF4 | EF5 |
| 65-85 mph | 86-110 mph | 111-135 mph | 136-165 mph | 166-200 mph | Over 200 mph |
| . | |||||
Tornadoes
Tornadoes, also known as twisters, are violent, narrow, spinning air columns stretching from a thunderstorm to the ground.
The winds of a tornado can reach 250mi/h (402km/h). These are some of the strongest winds on Earth.
Tornadoes are not really visible. What observers see, are condensed water droplets or the dirt and debris blown by the tornado funnel.
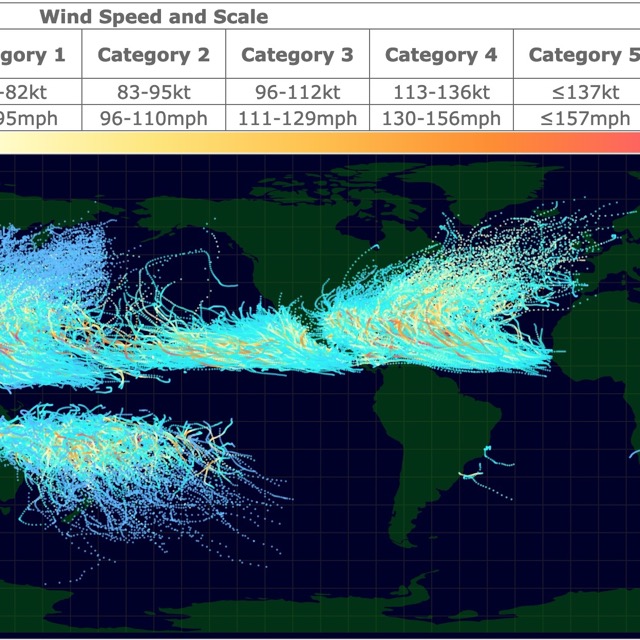
Do you like Climate maps? Visit this map of Tropical hurricanes
Tornado Formation
Certain conditions are required for tornadoes to form. These conditions have helped meteorologists forecast tornadoes. Nevertheless, it is still uncertain when, where, and how intense they will be.
For tornadoes to form, the air becomes unstable, with winds at different altitudes blowing in different directions and speeds. The result of this is a large thunderstorm.
Inside the thundercloud, warm and wet air rises, while cool air falls along with rain or hail. These factors also result in rolling and spinning air currents inside the cloud.
The spinning funnel is initially horizontal, but it will easily drop out of the cloud. Once it reaches the ground, it is a tornado. Source: Sciejinks.
Tornado Geography
Tornadoes occur in most continents throughout the world, including Europe, Africa, Australia, South America, and Asia. Nevertheless, they form between 20° and 60° latitudes north and south of the equator.
Tornadoes occur regularly in at least 20 countries worldwide. The U.S.A. experiences the most tornadoes annually, followed by Bangladesh and Argentina. Other countries that get a high number of tornadoes include Canada, England, New Zealand, Australia, Japan, India, and South Africa.
The United States has the strongest and highest number of tornadoes, averaging 1,150 to 1,200 every year. Furthermore, tornadoes have been recorded in all fifty states of the union!
To learn more about tornadoes and the people that study them, Amazon has the Tornado Hunter: Getting Inside the Most Violent Storms on Earth. This book portrays tornadoes, the science behind them, and the stories of their survivors.
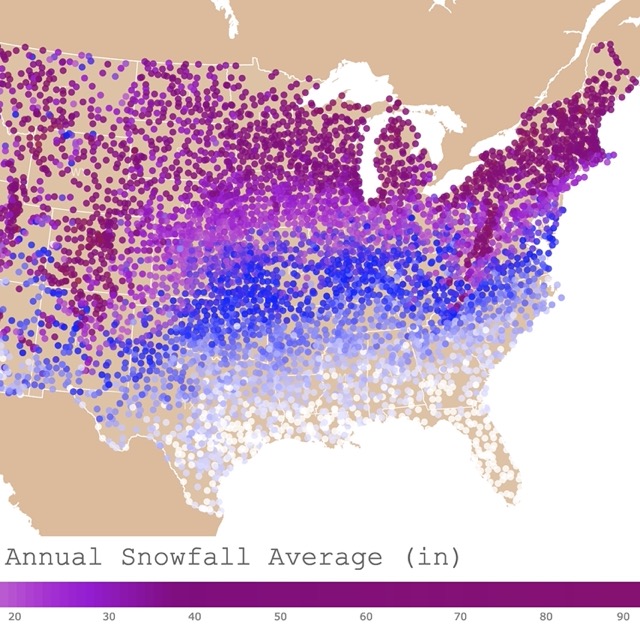
For more U.S. weather maps, visit Annual Snowfall in the U.S.A.
Tornado Alley
Tornado Alley is the name given to a large area of the U.S. with a high probability of tornado development.
This area is prone to tornadoes because the moist, warm air of the Gulf of Mexico meets the cool air from the Rocky Mountains. These cool and warm airstreams meet over the Great Plains and the south, shaping Tornado Alley.
Across the Plains, tornadoes are visible from miles away. Nevertheless, the southeast tornadoes hide in large swaths of hail and rain. This makes them hard to find, therefore, far more dangerous. The uneven terrain also restrains visibility in places like Georgia.
Tornado Alley maps look different from each other. This is because they differ in the way they are measured. It may be evaluated by county segments, strength, or time periods.
The term may be misleading as the threat moves from the Southeast in colder months to the midwest, southern, northern, and Central Plains in early summer.
Tornado Season
In the U.S., Tornado Season is the time of the year when tornadoes are more likely to form. The season varies depending on the location:
- May to early June: Southern Plains, Texas, Oklahoma, and Kansas.
- Early spring: Gulf Coast, Louisiana, Mississippi, Alabama.
- June to July: Northern Plains: North Dakota, South Dakota, Minnesota, Nebraska, and Iowa.
Regardless of the Tornado Season, tornadoes can form at any time of year and at any time of the day.
If you like checking the weather, you might like this gadget found on Amazon. It is the Smart Weather Station. It allows you to monitor your home and backyard conditions. It measures wind speed/direction, humidity, temperature, rainfall, UV, and solar radiation. With a Wi-Fi connection, it enables the transmission of data wirelessly!
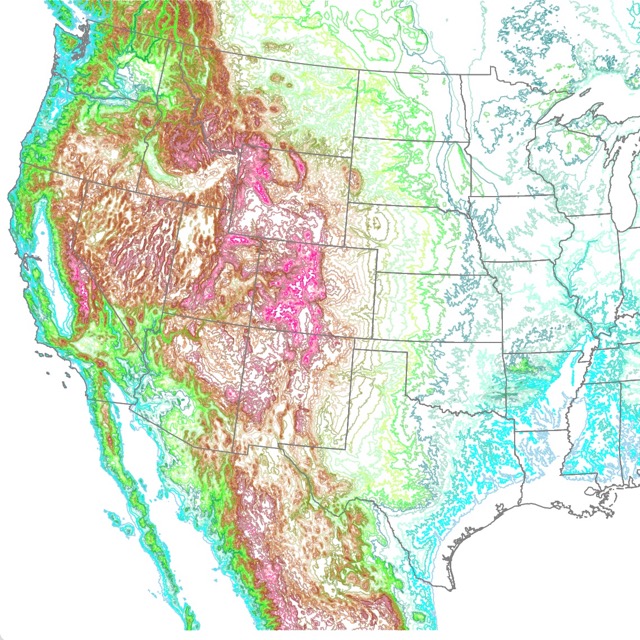
Terrain affects tornado formation. Interested? Visit this Map of U.S. Elevation
Tornado Rating
The National Weather Service (NWS) rates tornados by a number, from zero to five. The rating is estimated after assessing the twister's damage.
The scale was named after Dr. Ted Fujita. He developed the system to find a wind estimate for the amount of damage left after a tornado.
In 2007 the scale was improved on how the wind speeds were estimated. This is the Enhanced Fujita Scale; it goes from EF0 to EF5.
The NWS sends a team of meteorologists to direct surveys and assess the damage. In the case of small tornadoes, the NWS relies on photos or chaser reports to estimate EF rating. Source: AccuWeather.
Enhanced Fujita Scale
| Category | Winds | Damage | Description |
|---|---|---|---|
| EF0 | 65-85mph (104-136Km/h) | Light | Tree branches are broken and power lines are down. |
| EF1 | 86-110mph (138-177Km/h) | Moderate | Roofs turned off, cars blown off, mobile homes rolled, trees uprooted. |
| EF2 | 111-135mph (178-217Km/h) | Considerable | Large trees snapped or uprooted, cars lifted off, roofs torn. |
| EF3 | 136-165mph (218-265Km/h) | Severe | Forest trees uprooted, cars lifted, collapsed cell phone towers, and mobile homes destroyed. |
| EF4 | 166-200mph (267-321Km/h) | Devastating | Damaged high-rise buildings, collapsed school, and house walls. |
| EF5 | >200mph (>321Km/h) | Incredible | Extensive damage to high-rise buildings. House slabs are swept clean. |
Strongest Tornadoes
The U.S. storm systems cause about 80 deaths a yearly and nearly $1 billion in damage.
The deadliest tornado blew over Missouri, Illinois, and Indiana in 1925, leaving 695 deaths. It was followed by a tornado in MS in 1840, leaving behind 317 dead.
The deadliest tornado since 1950, displayed on this map, occurred in 2011 in Joplin, Missouri. It killed 158 people, injured 1,150, and resulted in over 2,8 billion dollars in damages. It was rated as an EF5 tornado.
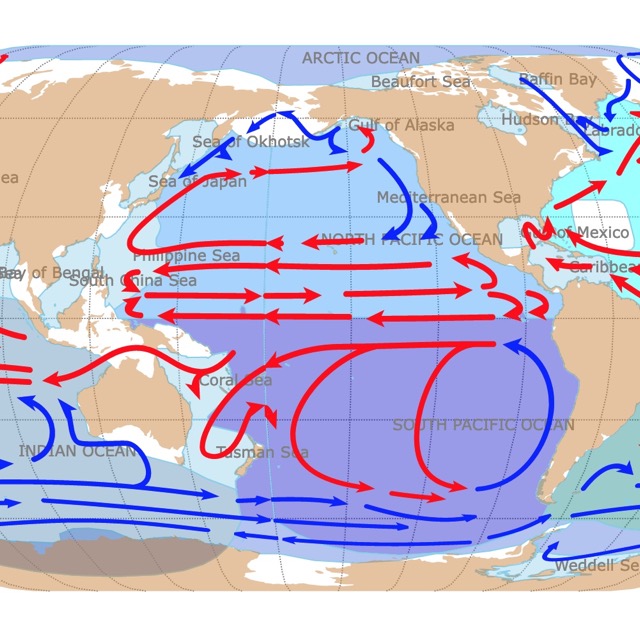
More about climate? Visit this map of Ocean Currents
Chasing Tornadoes
Meteorologists use weather balloons, weather satellites, and buoys to gather data from wind and other atmospheric parameters.
This data is analyzed by computers to determine where twisters might form and how strong they might be.
If weather conditions may form a tornado, a tornado watch is issued. This is for residents can be prepared. If it is found on a weather radar, then meteorologists issue a tornado warning for a small area. People are urged to take cover.
There are on the field scientists that drive to areas where tornadoes are forming. They use vehicles equipped to measure environmental factors like humidity, temperature, and air pressure.
These "tornado chasers" help scientists understand tornados. Source: National Geographic.
FOLLOW ME

Sources to Make Tornado Tracks Map
The state and country borders were downloaded from Natural Earth.
The Tornado shapefiles were downloaded from the Storm Prediction Center. It includes data from 1950 to 2021.
This map will be updated with new data! To receive updates on this and more nature maps, join my email list!!!!!!!
Made by Luz K. Molina with D3.js.