Buy or Rent Mapped
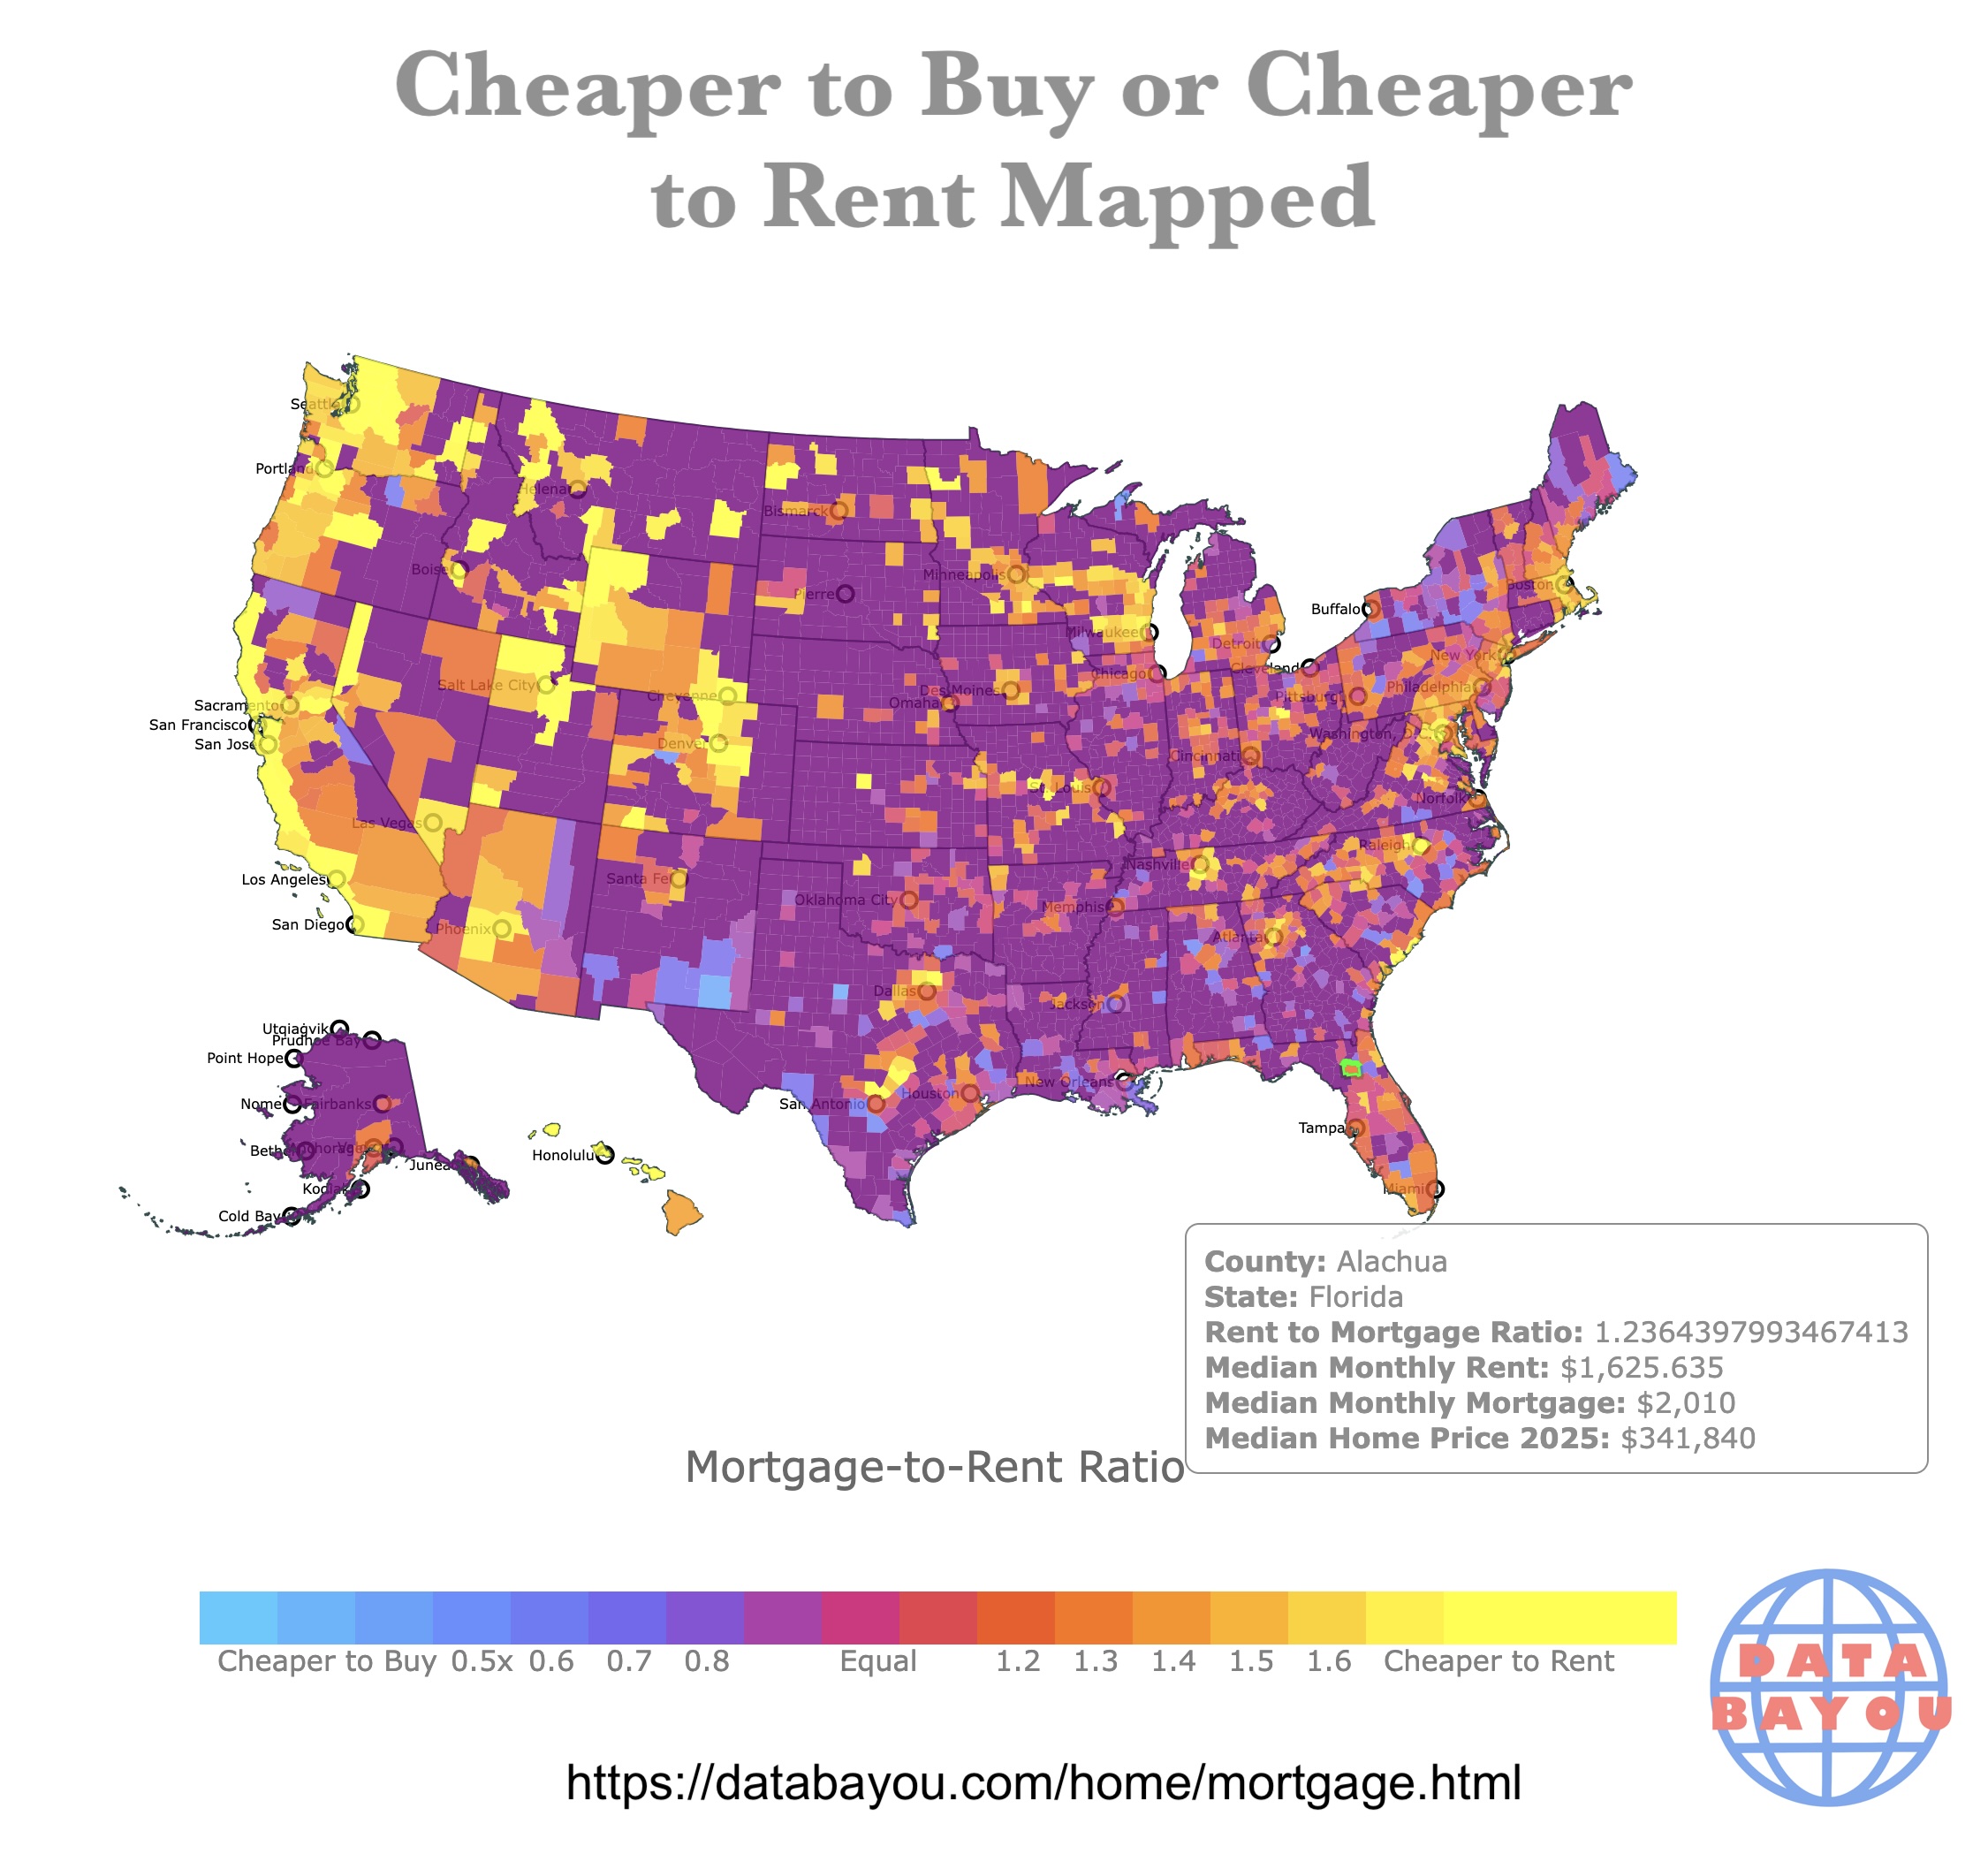
This interactive map shows if it is cheaper to rent or to buy in each U.S. county. Yellow shades represent cheaper monthly rent. Blue shades represent cheaper monthly mortgage. Hover over the map to see the county, state, median monthly rent, median monthly mortgage, and median home price. Zoom in for more detail. Scroll down for more information.
Mortgage-to-Rent Ratio
Is Mortgage or Rent Cheaper?
This map represents the Mortgage-to-Rent Ratio in most U.S. counties.
The monthly rental price by county is from Zillow.com. It has the ZORI (Zillow Observed Rent Index) Smoothed for all Homes Plus Multifamily Time Series. The data includes the median of the First Quarter of 2025.
The mortgage data is from the National Association of Realtors. It includes the median monthly mortgage of the First Quarter of 2025.
Realtors can help you decide if it is better to rent or buy depending on your needs and income. There are also several tools online to help you make that decision.
These tools include Rent vs Buy calculators that look at the time you will stay at the property, interest rate, loan term, and even tax filing status.
This map only displays monthly mortgage and monthly rent ratio.
Many counties have no data as they are rural and rent transactions are not common.
Nevertheless, most of the map shows a pattern seen since 2020. In most U.S. counties it is cheaper to rent than to buy, making home ownership a dream for most new home buyers in America.

Map of Population Change by County
Cheapest Buy-to-Rent Ratio
This and the following list include in some instances the largest metro in each county.
The number following each county is the buy-to-rent ratio.
- Olean, Cattaraugus County, New York: 0.61
- Lumberton, Robeson County, North Carolina: 0.58
- Jasper, Walker County, Alabama: 0.57
- San Antonio-New Braunfels, Atascosa County Texas: 0.56
- Putnam County, Georgia: 0.54
- Aspen, Pitkin County, Colorado: 0.52
- Houghton, Houghton County, Michigan: 0.51
- Abilene, Jones County, Texas: 0.38
- Carlsbad-Artesia, Eddy County, New Mexico: 0.38
Many of the counties on this list are in the South. This is not a surprise as most of them have a Low Household Income.
Other counties listed, even the ones North and South West, do have Low Home Price to Income Ratios.
Eddy County, NM, has the Carlslbad Caverns. If being a tourist hub brings down property prices, this is it.
Abilene in Jones County, TX is close to Dyess Air Force Base which might explain its low property values as Air Force workers don't settle in town.
Pitkin County, Colorado is a shock! This is one of the most elite locations in the USA. It has some of the most expensive real estate.
It probably comes down to the fact that renting in a ski town is more expensive than buying homes.
San Antonio in Atascosa County Texas has high affordability supported by local initiatives and a large supply of housing stock, including a mix of established neighborhoods and new developments.
If you want to read more about buying, renting, and investing, Amazon has Commercial Real Estate Property Investing Book: Beginners Guide on How to Finance, Rent or Build Wealth Buying & Selling.
If you’ve ever dreamed of owning buildings instead of just paying rent... of turning cash flow into financial freedom... or of finally cracking the code on how the wealthy multiply their money through real estate—this is your blueprint.
Most Expensive Buy-to-Rent Ratio
This list is extended as the first counties are part of San Francisco.
- San Francisco-Oakland-Berkeley, San Mateo County, California: 2.7
- San Jose-Sunnyvale-Santa Clara, Santa Clara County, California: 2.7
- San Francisco-Oakland-Berkeley, Marin County, California: 2.5
- San Francisco-Oakland-Berkeley, Alameda County, California: 2.4
- San Francisco-Oakland-Berkeley, San Francisco County, California: 2.4
- Seattle-Tacoma-Bellevue, King County, Washington: 2.3
- Washington-Arlington-Alexandria, Falls Church city, Virginia: 2.3
- Nashville-Davidson--Murfreesboro--Franklin, Williamson County, Tennessee: 2.2
- Custer County, Montana: 2.2
- Missoula County, Montana: 2.1
- Boulder, Boulder County, Colorado: 2.1
- Salt Lake City, Salt Lake County, Utah: 2.1
There are several characteristics that jump out in this list. San Francisco is the place to rent and not to buy.
Santa Clara and Alameda Counties in California are also 2 of the 3 counties in the whole United States that have a majority Asian population. They are minority-majority counties.
All these counties have some of the most highly educated populations in the country.
Three of these counties are known for skiing: Salt Lake, UT, Boulder, CO, and Missoula, MT, and Custer County MT. Unlike Pitkin, snow makes these locations cheaper to rent than to buy.
Nashville has turned into an incoming population hub for out of state residents who look for lower taxes.
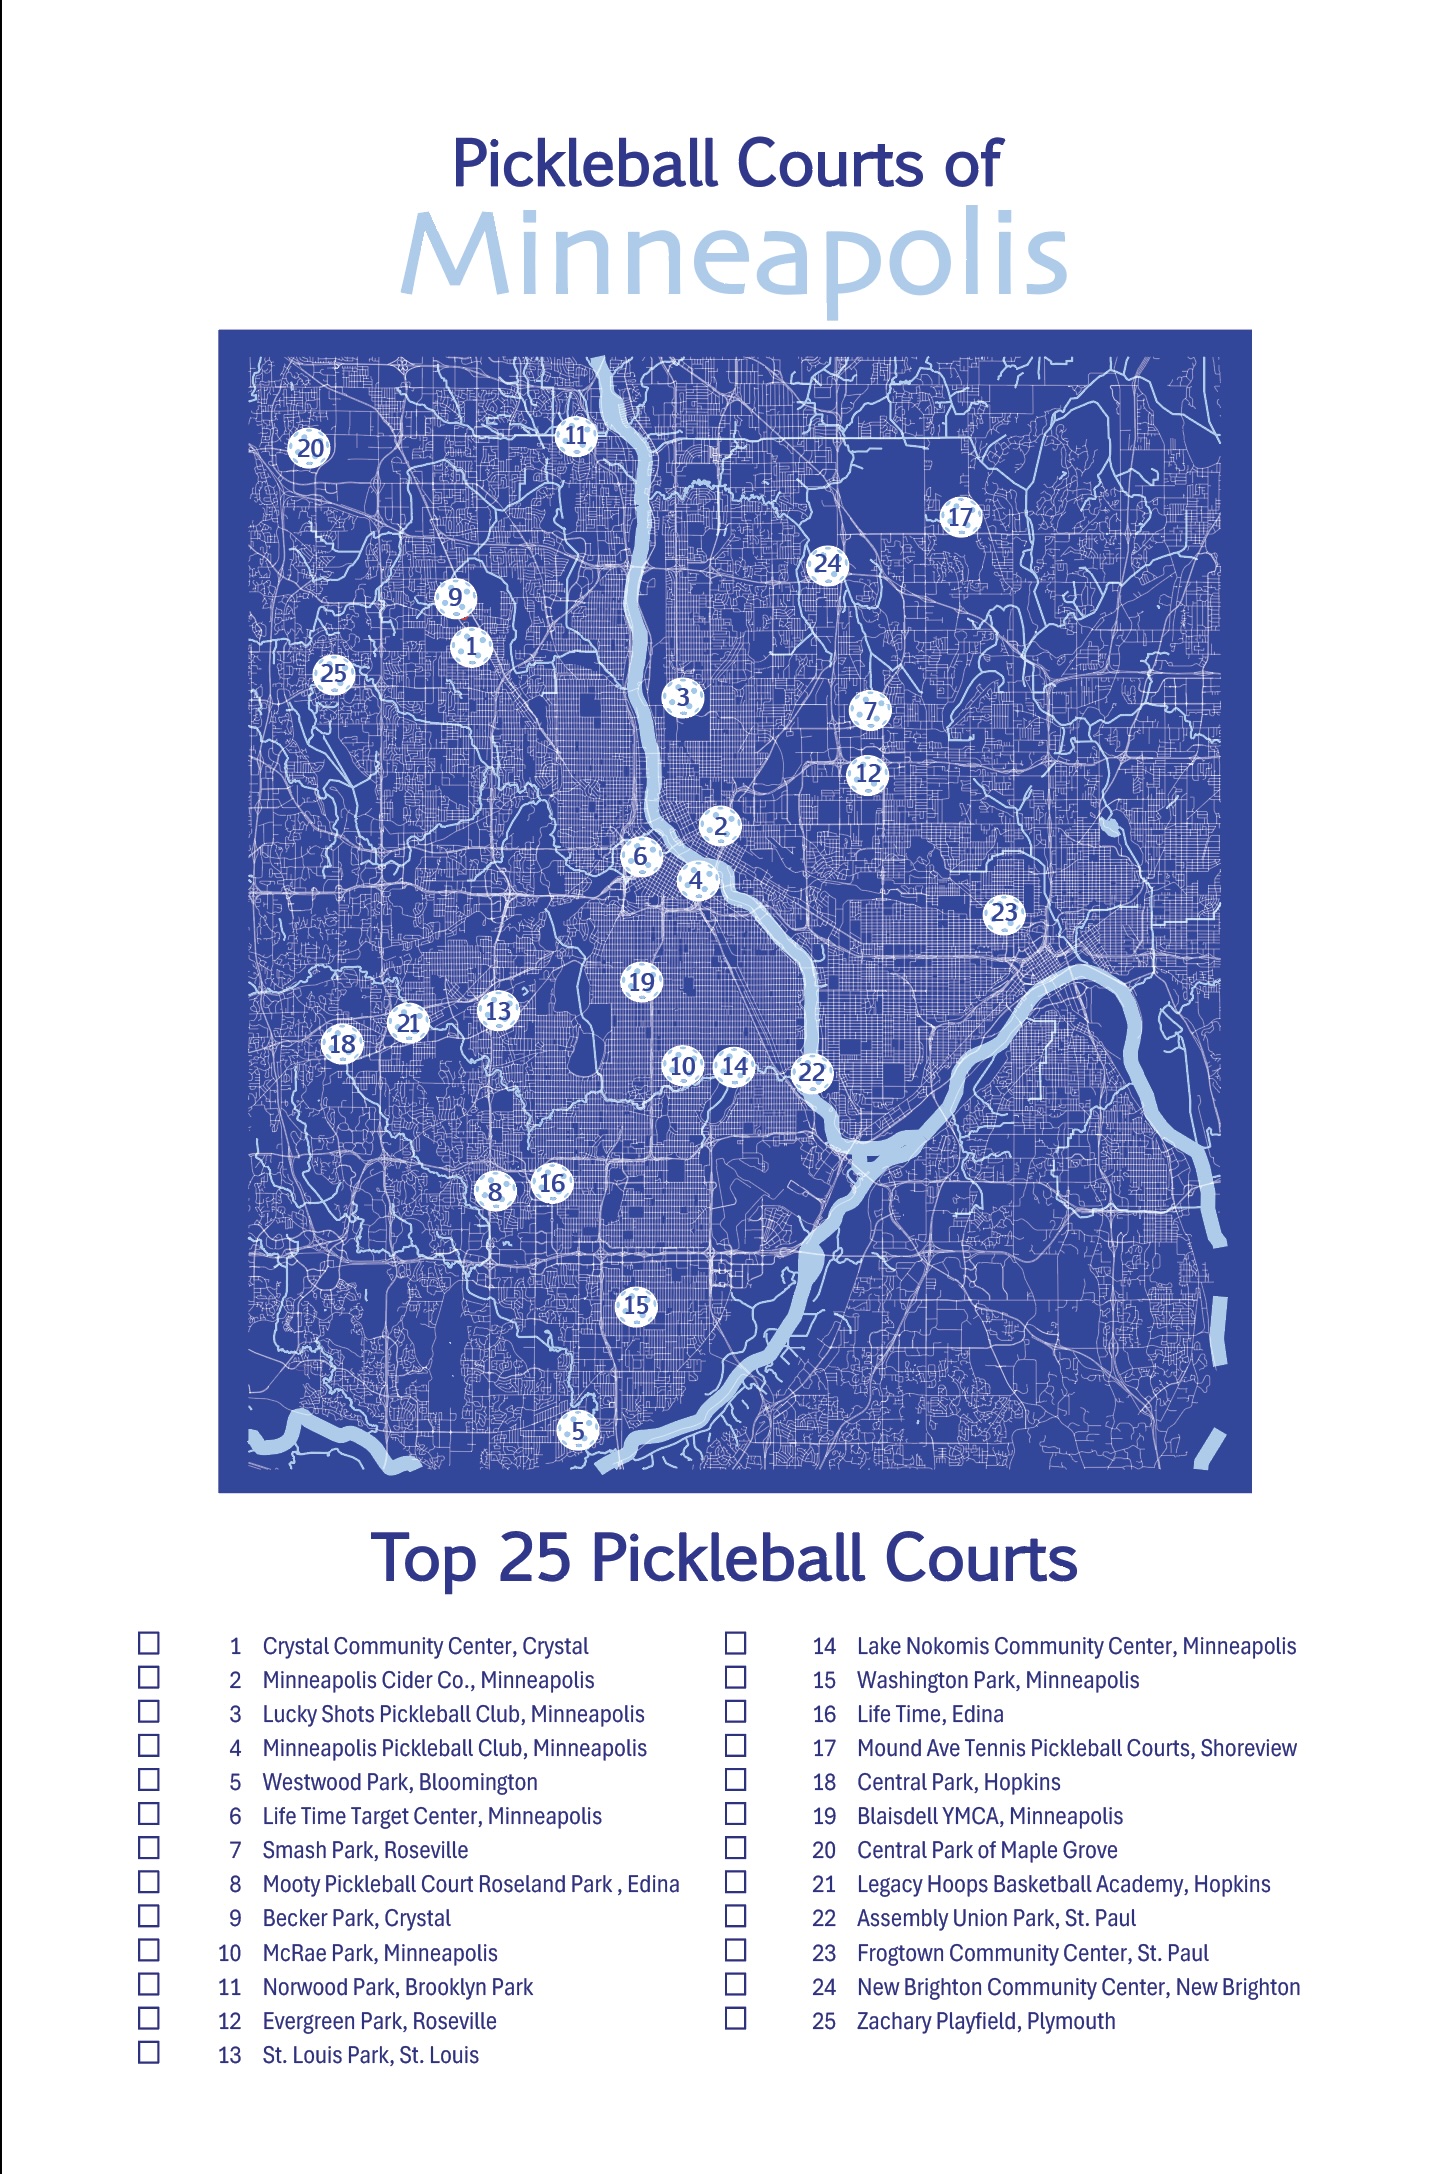
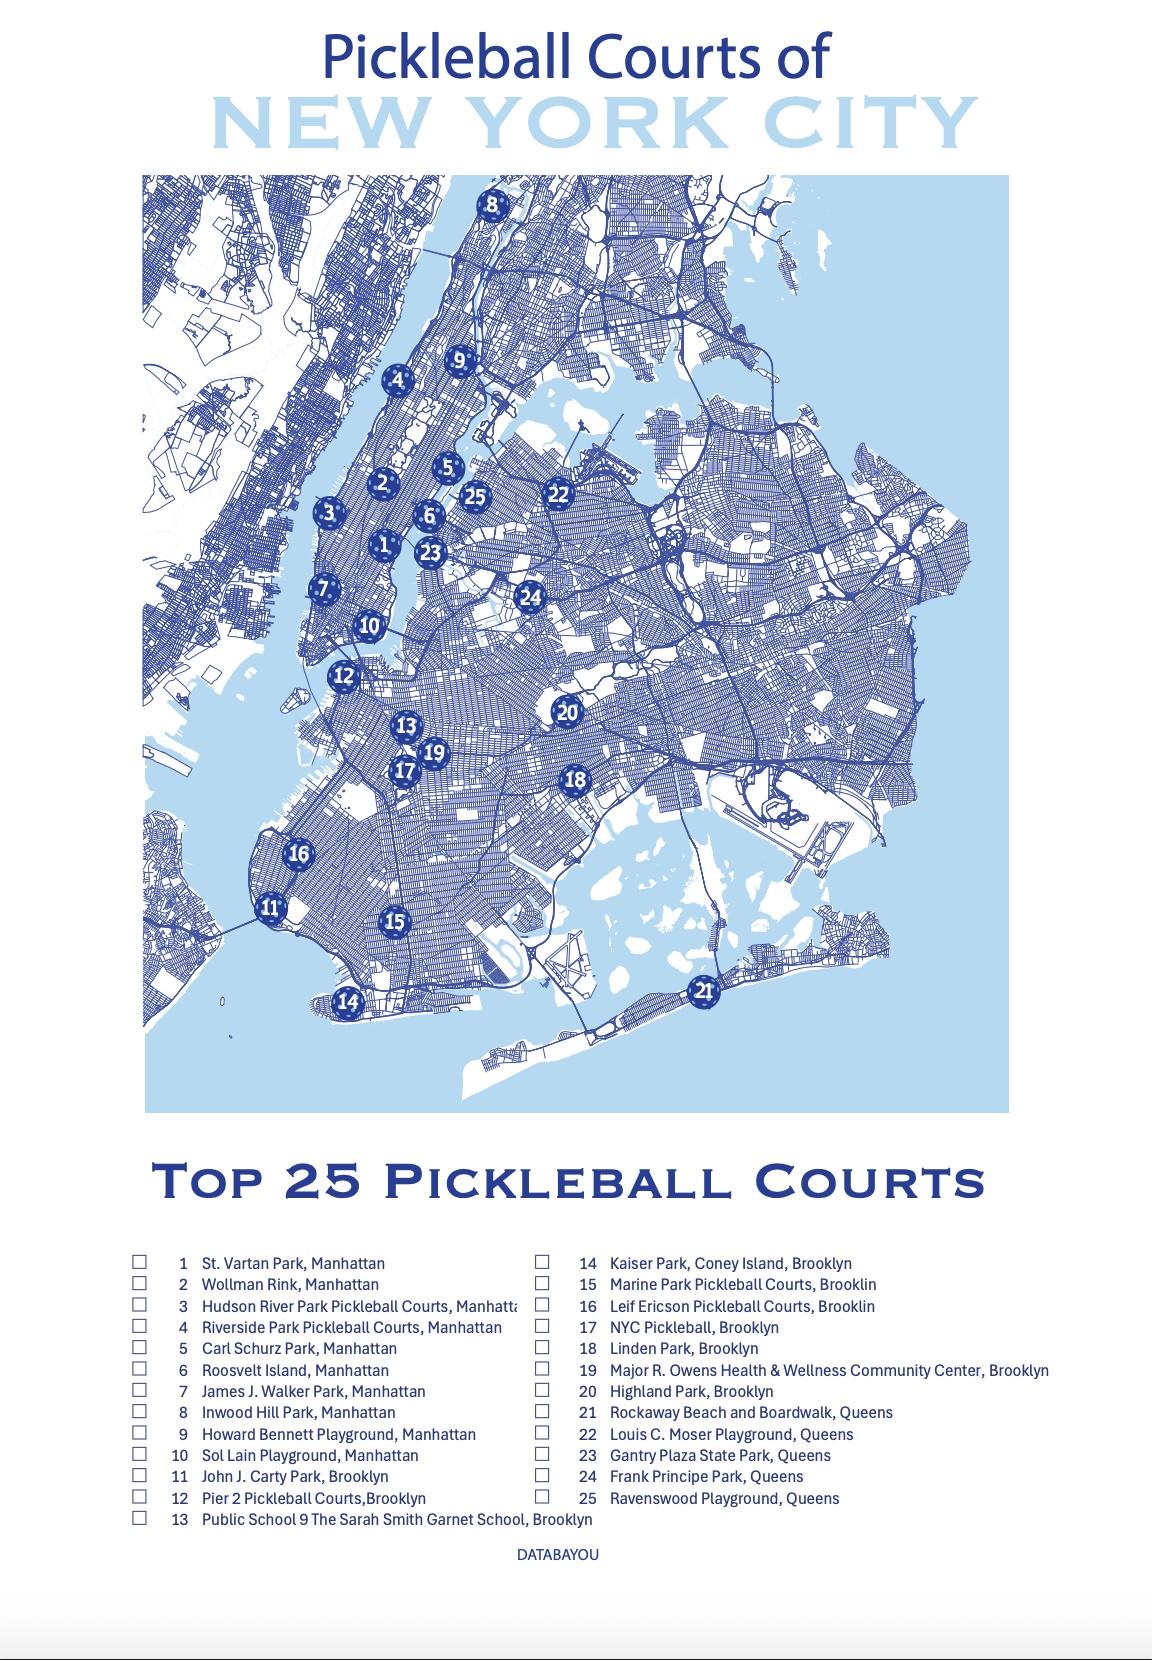
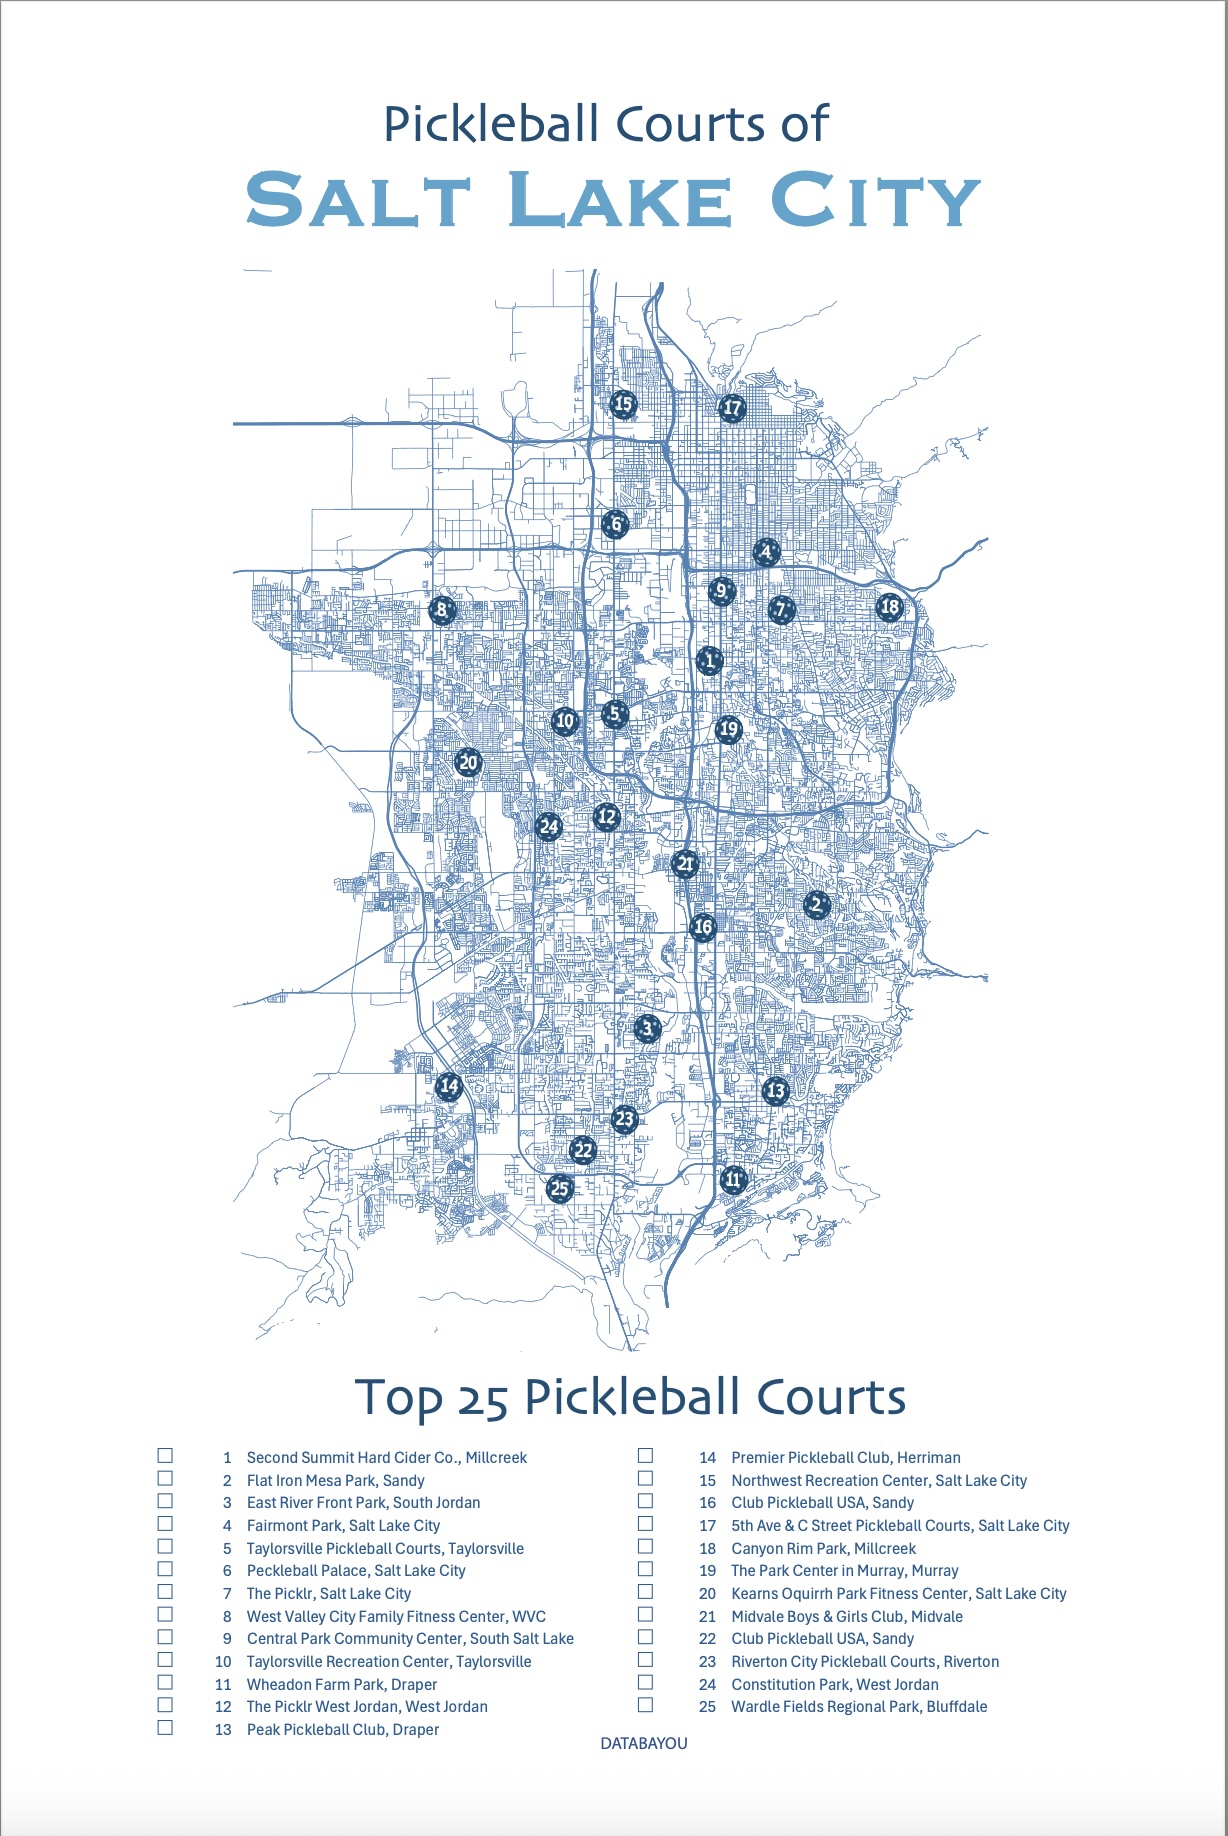
Buy the Top 25 Pickleball Courts Map Poster on Tiktok Shop
Follow Me
Resources for Rent or Buy Map
The shapefiles for the states were downloaded from Natural Earth.
The county shapefiles came from U.S. Census Bureau.
The rental data Zillow Observed Rent Index (ZORI). A smoothed measure of the typical observed market rate rent across a given region.
Mortgage data is from the NATIONAL ASSOCIATION OF REALTORS.
Made by Luz K with D3.js.
This map will be updated with improved and recent information! To receive updates on this and more maps, join my email list!!!!!!!