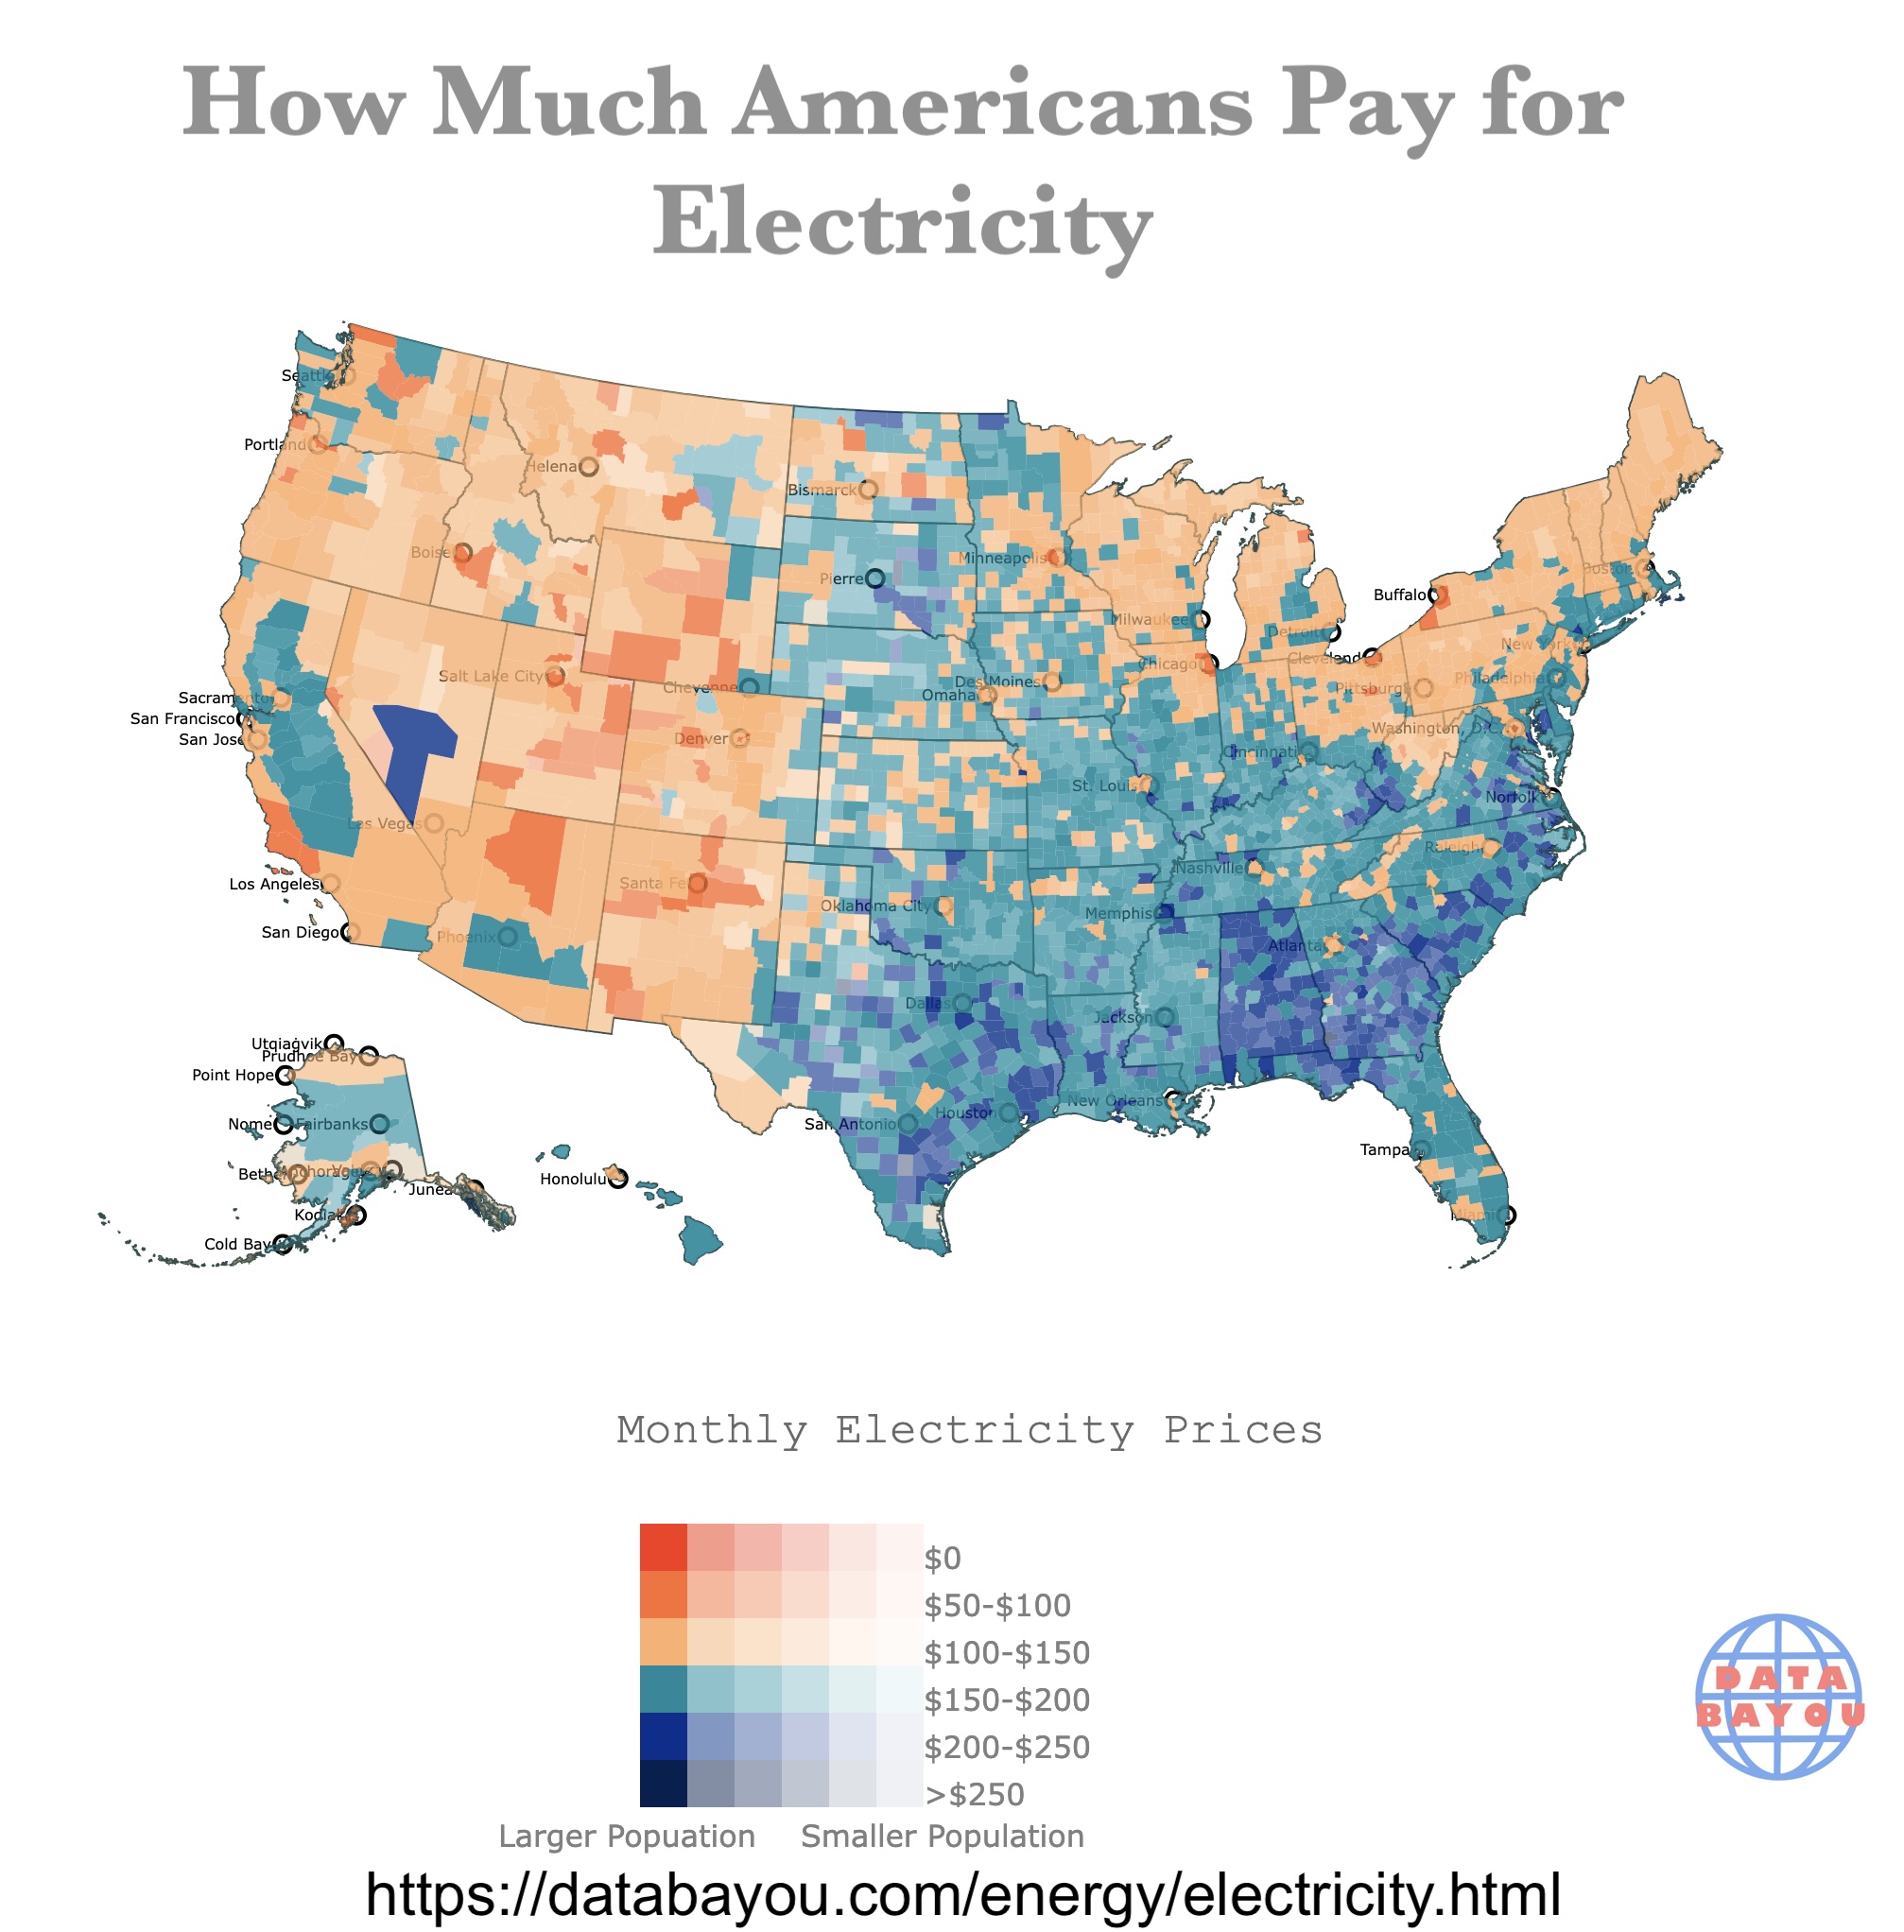
Map of Median Electricity Prices by County
This is an interactive map of how much Americans pay for electricity every month. Green and blue hues represent higher monthly prices. Darker colors indicate counties with larger populations. Hover for especific values per county. Zoom in for more details. Scroll down for more information.
Monthly Electricity Prices
How Much Americans Pay for Electricity
Did you ever wonder, how much your neighbors pay for electricity? Even better, did you think you were paying more than they did?
This American Community Survey Census data is from 2018-2023. It shows how much Americans pay in electric bills each month. The data is clustered in groups.
Each county's color, represents the 50th percentile of households paying a specific amount.
Southern states pay higher prices for their electricity. Fortunately, the counties in these states do not suffer from extreme winters.
Meanwhile, counties in western states have lower electric bills.
Highest Median Electricity Prices
- McMullen County, Texas
- Kent County, Texas
- Hyde County, South Dakota
- Franklin City, Virginia
- Sitka City and Borough, Alaska
Lowest Median Electricity Prices
- Kenedy County, Texas
- Kalawao County, Hawaii
- Loving County, Texas
It baffles me why the highest and the lowest paying counties are in Texas. Nevertheless, some of these counties have a small populations and are oil drilling counties which might explain extreme values.
Loving County, Texas is a can of worms you can read about in the link.

Map of Median Home Size by county
Factors Affecting Electric Bill Pricing
It is obvious that inflation is affecting prices for everything, but household bills are payments Americans have very little influence over changing once they move into a house.
Lately there has been a lot of talk about data centers driving up electricity costs, but what are the main factors driving up prices?
In some locations like Alaska and Hawaii fuel prices radically affect the price of electricity.
Other factors include power plant costs, transmission and distribution systems.
Weather conditions definitely affect prices. Extreme temperatures increase the demand for heating and cooling, which also results in increased prices.
Rain and snow provide water for affordable hydropower generation.
Other renewable energy sources like wind have proven to be cheap and common in places like the Midwest.
In other instances regulations are the major factor that affect electricity bills.
For an in-depth look at how electricity prices are calculated, Amazon has Modeling and Forecasting Electricity Loads and Prices: A Statistical Approach (The Wiley Finance Series).
This book offers an in-depth and up-to-date review of different statistical tools that can be used to analyze and forecast electricity prices and loads.
Follow Me
Resources for Heating in the United States Map
The Shapefiles for the states were downloaded from Natural Earth.
The county shapefiles and the electricity prices were downloaded from the US Census Bureau.
This map will be updated with improved and recent information! To receive updates on this and more maps, join my email list!!!!!!!