Elevation Map of the U.S.
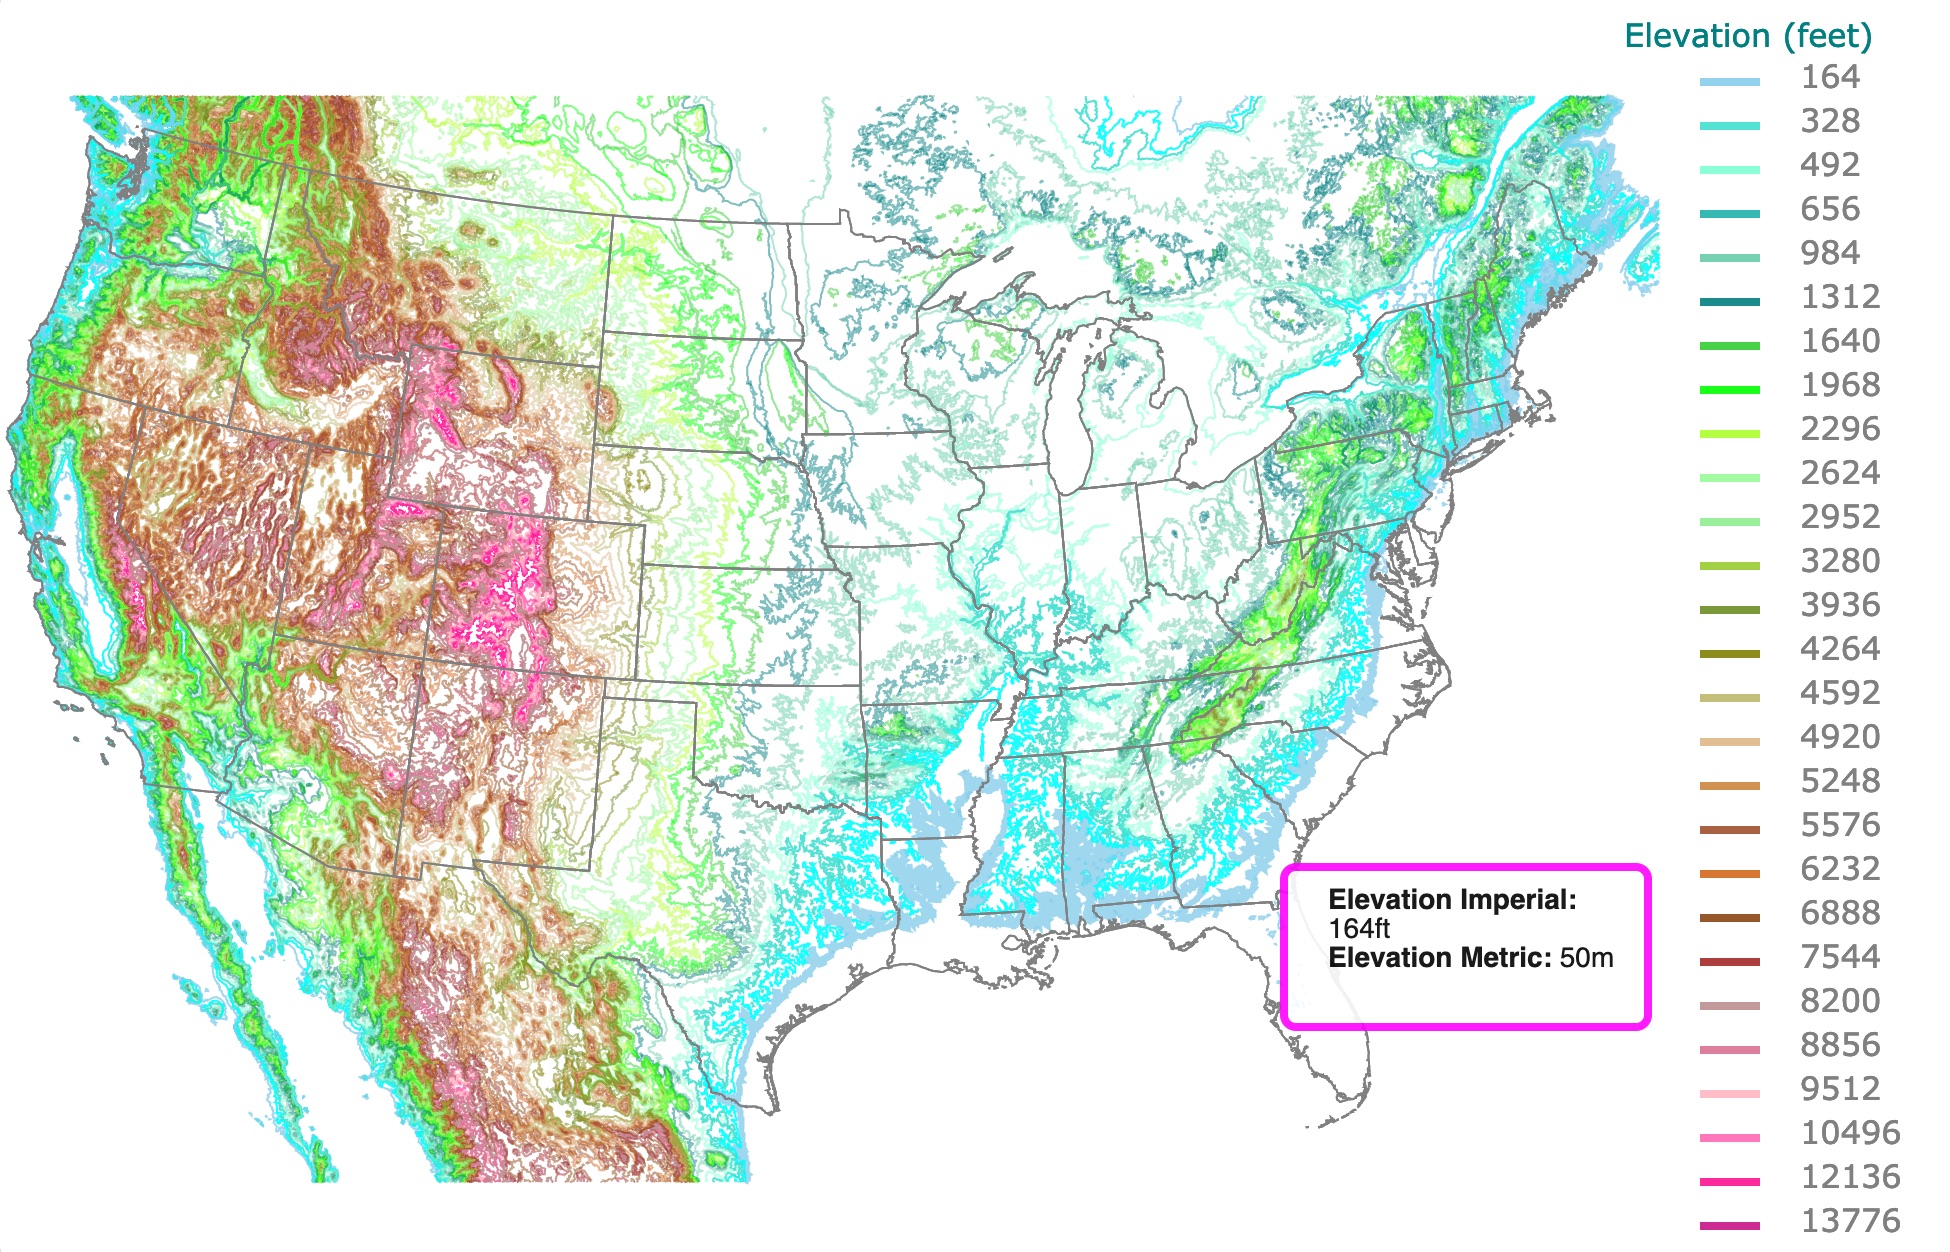
This contour map shows the topography of the continuous United States of America. Hover over the map to highlight the contour and see the elevation in feet and meters. For more detail, zoom in. For more information, scroll down.
Contour Map
As you scan this contour map, it is easy to get lost in the mountains and forget about the Gulf Coast. In fact, the Gulf Coast is a bit disappointing to look at. But that is where the disappointment ends.
Mountain ranges like the Rockies and the Smokies show features not visible in your average Google map.
It is quite interesting to see a glimpse of the Mississippi River and the Saint Lawrence River through this topographic map.
A major surprise was the Snake River Plain in Idaho. It is a feature hidden in plain sight, which is highlighted in this map.
In times of social distancing and isolation, this map will help you decide where to go, and what to do outdoors. What could be the best location for amazing views? Where can you find different elevations and features in a single place? Explore the U.S., it has lots of landscapes worth your time to see!
Topographic Maps
What is a topographic map? A Topographic map is another name for a Contour map; it shows the land elevation on a flat paper surface. They are a convenient way to visualize flat and steep terrain, especially for hikers or other people navigating with maps.
Topographic Maps, also known as “Topos”, complement aerial photography as a way to represent the Earth’s surface. A topo map is a two (2) dimensional representation of our three (3) dimensional world. Both horizontal and vertical data can be recorded.
Most printed topographic maps include these map essentials:
- Date
- Orientation or Compass Rose
- Grid lines
- Scale
- Title
- Author
- Legend
- Sources
- Index (the part of the grid where specific information can be located)
Topographic maps are essential in evaluating a property's geologic, hydrogeologic, hydrologic, and topographic characteristics.
Historical topographic maps help determine how topography and property development have changed over time and indicate possible risks or concerns Source: Historic Aerials
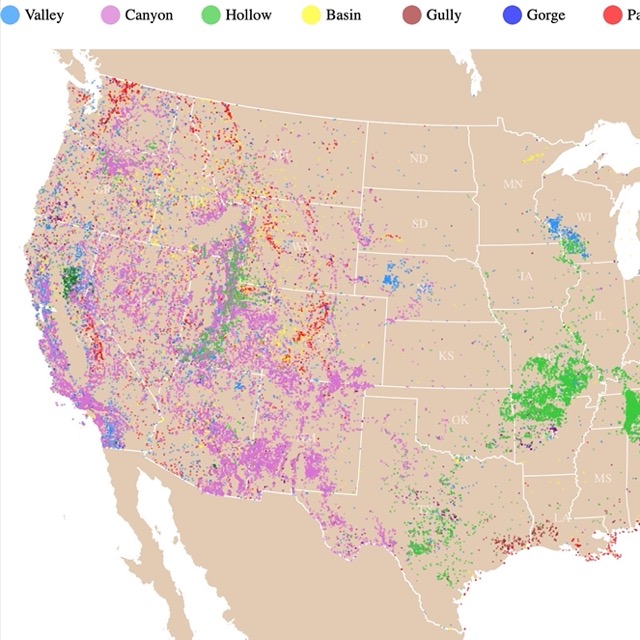
This map shows you where Valleys, Canyons, and Gorges are found throughout the U.S.A.
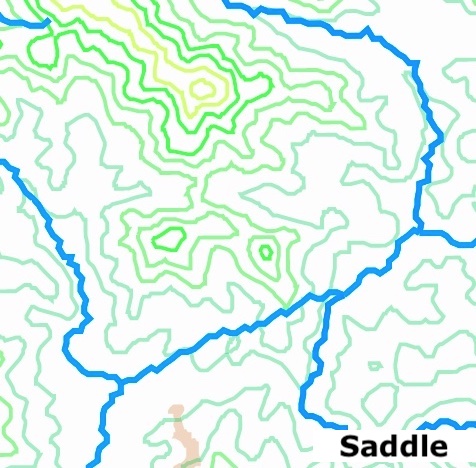
Contour Lines
What is a contour line? Contour lines mark points of equal elevation on a map. Therefore, each point on that line is the same height above sea level. Greenbelly describes different formations that can be observed with contour lines:
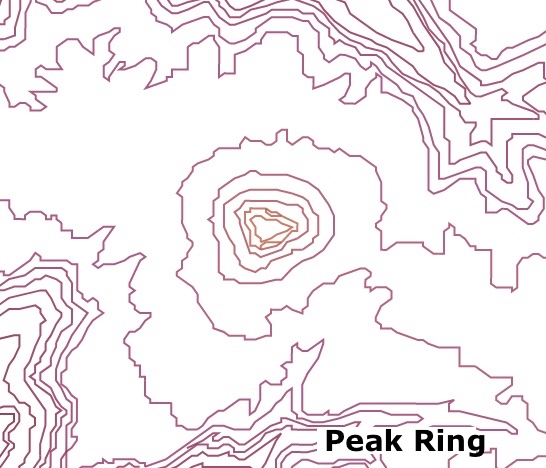
- Peak Ring: The innermost ring at the center of several contour loops almost always represents a peak (highest elevation). In this map, the highest points have reddish colors.
- Depression Ring: Occasionally, an inner ring indicates a depression (lowest elevation). In this map, lower contours have greenish colors.
- Cliff: If you see two or more lines converge until they appear as a single line, this represents a cliff.
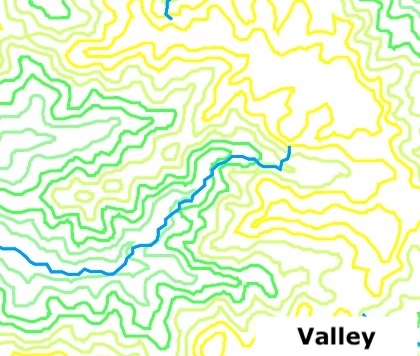
- Valleys: When contour lines cross a valley or a stream, they make a sharp-pointed V or U-shape.
- Ledge: Ledges or flat areas on the side of a mountain appear as protruding U-shapes that point away from the peak.
- Ridgeline: Think of a ridgeline as an elongated peak, not coming to a fine point. Instead of a closed inner circle, a ridgeline can look like a big oval.
- Saddle: A saddle is a low-lying area between two higher elevation points. They appear as hourglass shapes between two concentric circles. Identifying saddles can show you the quickest route through hilly areas.
"The U.S. Geological Survey (USGS) used to be the gold standard for topo maps. Its maps consisted of rectangular areas of land called quadrangles (“quads” for short).
Once available in most stores and other outdoor shops, preprinted USGS maps are being phased out. They are replaced by online resources that allow map data to be continually updated.
Maps downloaded and printed like this have major drawbacks: limited trail information and lack of in-the-field verification." Source: REI
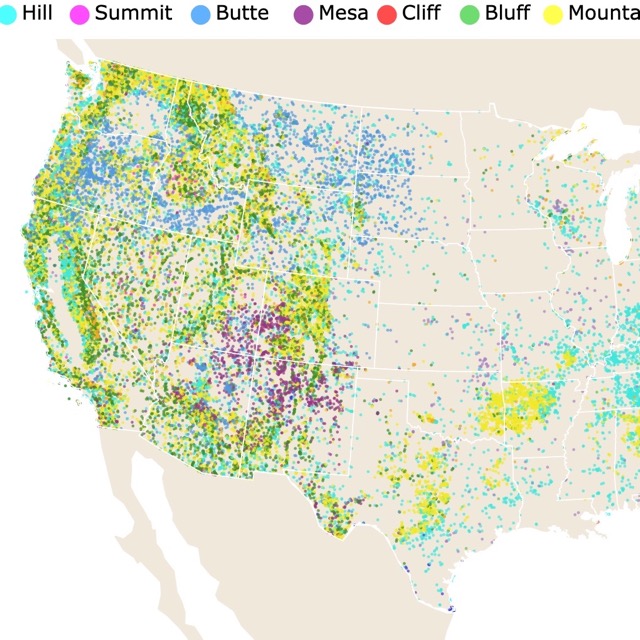
Name maps are not just for water bodies. This map shows hills and mounts.
History of Contour Maps
The oldest known topographic map was made in ancient Egypt during the Twentieth Dynasty, 2300 B.C.
This papyrus map is currently in Turin, Italy, but there is disagreement on its actual age and use. It is suggested that the map also had geologic information of the area; JSTOR.
No other topographic map was made until the eighteenth century in France. This map was the first multi-sheet topographic map series of an entire country. It was called the Carte géométrique de la France, completed in 1789".
Following this cartographic accomplishment is the Great Trigonometric Survey of India, started by the East India Company in 1802.
This survey was then taken over by the British Raj after 1857. It was a notable success as a larger-scale enterprise, accurately determining the heights of the Himalayan peaks from viewpoints over one hundred miles away. Wikipedia
U.S. Topography
"On December 4–5, 1884, John Wesley Powell persuaded the U.S. Congress to authorize the U.S. Geological Survey (USGS) to begin systematic topographic mapping of the United States. In the late 19th century, surveyors created topographic maps in the field. They measured a series of points in the field, using tape and compass traverses with elevations determined with an aneroid barometer and used in a process known as field sketching to draw a terrain representation using contours.
The introduction of the plane table and alidade, which could measure vertical angles, point positions, and elevations much more rapidly, greatly increased the accuracy of data shown on topographic maps but still required the surveyor to field sketch the contours after control points had been identified. The aid of three-dimensional visual model in the office to construct the surface representation awaited the development of photogrammetry." ESRI
"During this time, USGS maps were created at scales of 1:250,000 for 1-degree areas and 1:125,000 for 30-minute areas. The scales were increased with time, and by 1894, most of the maps were created for 15-minute areas and produced at a scale of 1:62,500. Features shown on the maps included civil divisions of state, county, township, and city or village; public works, including railroads, tunnels, wagon roads, trails, bridges, ferries, fords, dams, canals, and acequias; hypsography with contours and floodplain representations; and miscellaneous features of forest, sand, and sand dunes." ESRI
Beginning in the 1920s, the USGS began experimenting with photogrammetry to replace the time requirements of field sketching.
Starting in 2001, the USGS released The National Map to be the topographic map of the 21st Century. It is a seamless, continuously maintained, nationally consistent set of base geographic data.
The new topo maps consist of eight (8) data layers: transportation, hydrography, boundaries, structures, geographic names, land cover, elevation, and orthographic images.
In October 2009, contours and hydrography were added to the new map, which was renamed U.S. Topo. Source: Historic Aerials
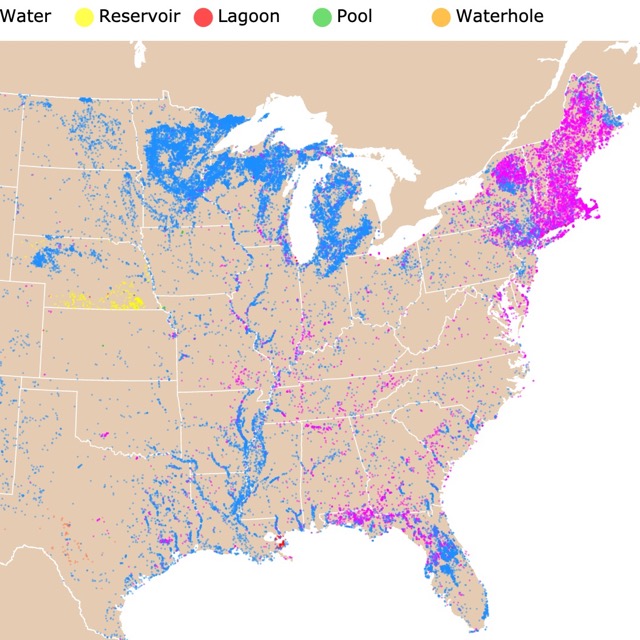
This map shows you where Lakes, Ponds, and Lagoons are located.
Resources for the Contour Map
To my surprise, elevations were provided in meters, not in feet. This was fixed for this map. Also 3.28 - 32.8ft (1-10m) is not included.
The lowest elevation is 165ft (50m). This is why Florida and other coastal states are mainly white. The contour shapefiles were downloaded from USGS Science Base Science Catalogue. The States shapefiles are from Natural Earth. The code was modified from my World Bathymetry Map.
This is a Bathymetry map. It shows underwater depth. For more information, check it out!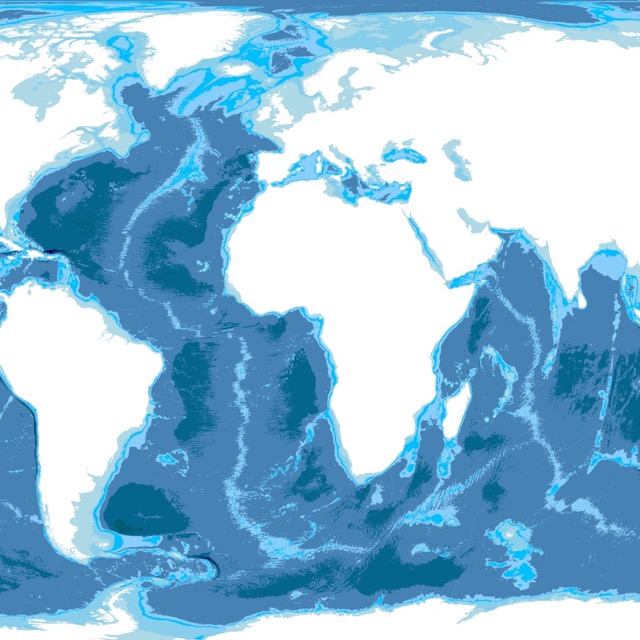
FOLLOW ME
Elevation Map Inspiration
I made a Bathymetry map a while ago. Ever since I have wanted to make a similar map of elevations. I definitely wanted to make it with D3.js.
Initially, I had a hard time finding shapefiles of contours, and I did not see many examples online.
Eventually, I found the shapefiles for the U.S. and came up with this map. My first attempts where very colorful and vivid. I wanted something tamer, but after several trials this was my best result.
It is not the best because of the beautiful colors, but because it shows features that were not visible with other color combinations.
This map will be updated with new data! To receive updates on this and more nature maps, join my email list!!!!!!!
Made by Luz K. Molina with D3.js.